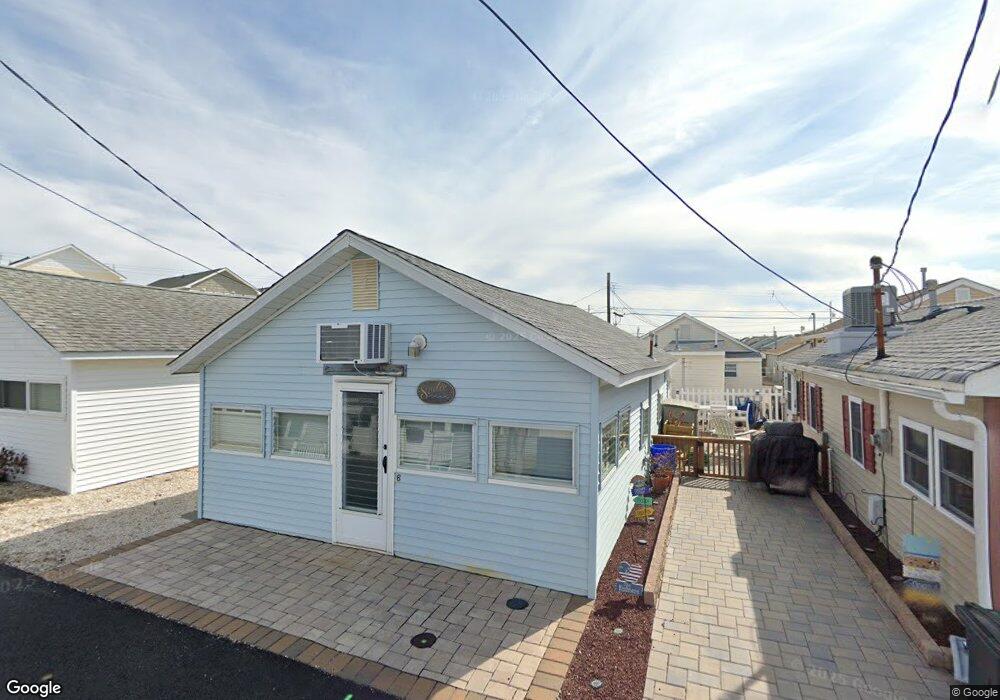
6 2nd Ln Seaside Park, NJ 08752
Estimated Value: $358,591 - $574,000
2
Beds
1
Bath
432
Sq Ft
$1,157/Sq Ft
Est. Value
About This Home
This home is located at 6 2nd Ln, Seaside Park, NJ 08752 and is currently estimated at $499,648, approximately $1,156 per square foot. 6 2nd Ln is a home located in Ocean County with nearby schools including Central Regional Middle School and Central Regional High School.
Ownership History
Date
Name
Owned For
Owner Type
Purchase Details
Closed on
Dec 14, 2016
Sold by
Wallace David and Wallace Michelle
Bought by
Pungello Steven and Pungello Angela
Current Estimated Value
Home Financials for this Owner
Home Financials are based on the most recent Mortgage that was taken out on this home.
Original Mortgage
$223,000
Outstanding Balance
$182,845
Interest Rate
4.03%
Mortgage Type
New Conventional
Estimated Equity
$316,803
Purchase Details
Closed on
May 14, 2004
Sold by
Gasior Walter J and Gasior Isabel
Bought by
Wallace David and Wallace Michelle
Create a Home Valuation Report for This Property
The Home Valuation Report is an in-depth analysis detailing your home's value as well as a comparison with similar homes in the area
Home Values in the Area
Average Home Value in this Area
Purchase History
| Date | Buyer | Sale Price | Title Company |
|---|---|---|---|
| Pungello Steven | $298,000 | -- | |
| Wallace David | $255,000 | None Available |
Source: Public Records
Mortgage History
| Date | Status | Borrower | Loan Amount |
|---|---|---|---|
| Open | Pungello Steven | $223,000 |
Source: Public Records
Tax History Compared to Growth
Tax History
| Year | Tax Paid | Tax Assessment Tax Assessment Total Assessment is a certain percentage of the fair market value that is determined by local assessors to be the total taxable value of land and additions on the property. | Land | Improvement |
|---|---|---|---|---|
| 2025 | $7,120 | $295,300 | $282,000 | $13,300 |
| 2024 | $6,851 | $295,300 | $282,000 | $13,300 |
| 2023 | $6,724 | $295,300 | $282,000 | $13,300 |
| 2022 | $6,724 | $295,300 | $282,000 | $13,300 |
| 2021 | $6,582 | $295,300 | $282,000 | $13,300 |
| 2020 | $6,582 | $295,300 | $282,000 | $13,300 |
| 2019 | $6,399 | $295,300 | $282,000 | $13,300 |
| 2018 | $6,378 | $295,300 | $282,000 | $13,300 |
| 2017 | $6,142 | $295,300 | $282,000 | $13,300 |
| 2016 | $6,110 | $295,300 | $282,000 | $13,300 |
| 2015 | $5,941 | $295,300 | $282,000 | $13,300 |
| 2014 | $5,773 | $295,300 | $282,000 | $13,300 |
Source: Public Records
Map
Nearby Homes