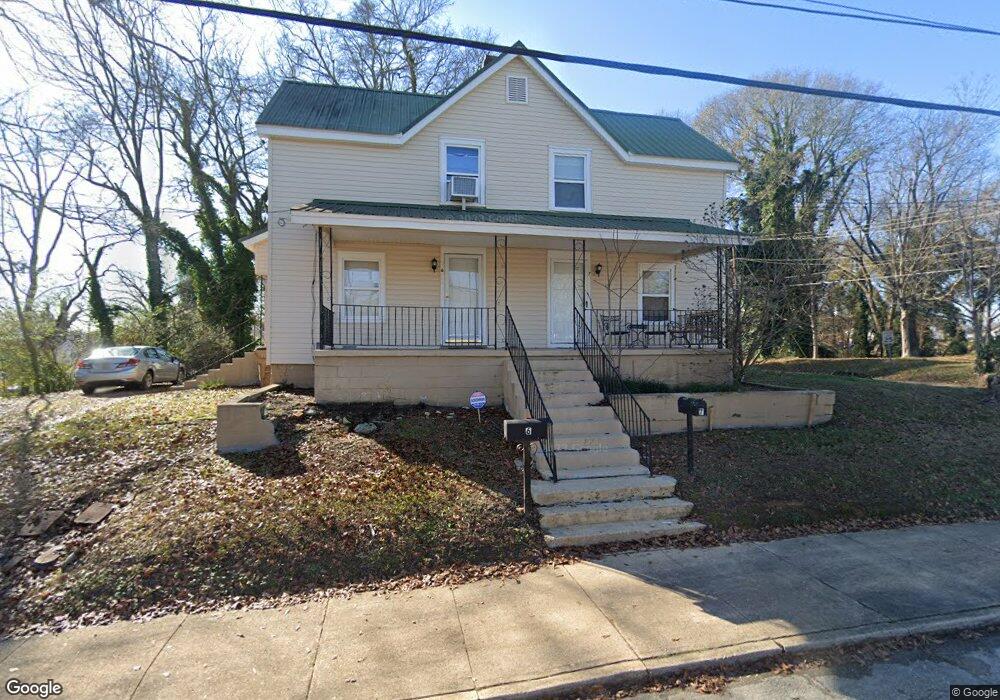
6-7 Spring St Gainesville, GA 30501
New Holland Village NeighborhoodEstimated Value: $264,000 - $296,927
4
Beds
2
Baths
1,848
Sq Ft
$152/Sq Ft
Est. Value
About This Home
This home is located at 6-7 Spring St, Gainesville, GA 30501 and is currently estimated at $281,232, approximately $152 per square foot. 6-7 Spring St is a home located in Hall County with nearby schools including East Hall Middle School, East Hall High School, and Lakeview Academy.
Ownership History
Date
Name
Owned For
Owner Type
Purchase Details
Closed on
Apr 30, 2024
Sold by
Wheeler Justin D
Bought by
Kim Joshua
Current Estimated Value
Home Financials for this Owner
Home Financials are based on the most recent Mortgage that was taken out on this home.
Original Mortgage
$198,750
Outstanding Balance
$191,624
Interest Rate
6.82%
Mortgage Type
New Conventional
Estimated Equity
$89,608
Purchase Details
Closed on
Jul 20, 2016
Sold by
C Banks Properties Llc
Bought by
Wheeler Justin D
Home Financials for this Owner
Home Financials are based on the most recent Mortgage that was taken out on this home.
Original Mortgage
$98,188
Interest Rate
3.37%
Mortgage Type
FHA
Purchase Details
Closed on
Sep 29, 2015
Sold by
Banks Z Michael
Bought by
C Banks Properties Llc
Purchase Details
Closed on
Aug 14, 2006
Sold by
Banks Lenice L
Bought by
Sundowner Development Co Llc
Purchase Details
Closed on
Dec 15, 2004
Sold by
Waldrep George Richard
Bought by
Banks Lenice L
Create a Home Valuation Report for This Property
The Home Valuation Report is an in-depth analysis detailing your home's value as well as a comparison with similar homes in the area
Home Values in the Area
Average Home Value in this Area
Purchase History
| Date | Buyer | Sale Price | Title Company |
|---|---|---|---|
| Kim Joshua | $265,000 | -- | |
| Wheeler Justin D | $100,000 | -- | |
| C Banks Properties Llc | -- | -- | |
| Sundowner Development Co Llc | -- | -- | |
| Banks Lenice L | $105,000 | -- |
Source: Public Records
Mortgage History
| Date | Status | Borrower | Loan Amount |
|---|---|---|---|
| Open | Kim Joshua | $198,750 | |
| Previous Owner | Wheeler Justin D | $98,188 |
Source: Public Records
Tax History
| Year | Tax Paid | Tax Assessment Tax Assessment Total Assessment is a certain percentage of the fair market value that is determined by local assessors to be the total taxable value of land and additions on the property. | Land | Improvement |
|---|---|---|---|---|
| 2025 | $2,695 | $110,040 | $11,680 | $98,360 |
| 2024 | $2,518 | $100,960 | $13,560 | $87,400 |
| 2023 | $2,097 | $99,720 | $11,960 | $87,760 |
| 2022 | $2,159 | $82,960 | $6,360 | $76,600 |
| 2021 | $1,733 | $65,200 | $4,760 | $60,440 |
| 2020 | $1,438 | $52,480 | $2,520 | $49,960 |
| 2019 | $1,425 | $51,560 | $2,240 | $49,320 |
| 2018 | $1,275 | $44,640 | $3,200 | $41,440 |
| 2017 | $1,080 | $38,080 | $2,320 | $35,760 |
| 2016 | $572 | $18,298 | $2,320 | $15,978 |
| 2015 | $576 | $18,298 | $2,320 | $15,978 |
| 2014 | $576 | $18,298 | $2,320 | $15,978 |
Source: Public Records
Map
Nearby Homes
- 37 Spring St
- 24 E Main St
- 4127 Millstone Park Ln
- 4127 Millstone Park Ln Unit 7A
- 1203 E Ridge Rd
- 1183 E Ridge Rd
- 2046 Old Cornelia Hwy
- 1553 Assembly Cir
- 1971 Assembly (Lot 164) Cir
- 1549 Assembly Cir
- 1340 Vine St NE
- 1304 Vine St NE
- 00 Jesse Jewell Pkwy
- 2180 Sunrise Dr
- 2202 Jesse Jewell Pkwy NE
- 1238 Mill St SE
- 1173 Saint Charles Place
- 1180 Springdale Rd
- 549 Park Street Place
- 915 Charleston Ct
- 6-7 Spring St Unit 6-7
- 7 Spring St
- 6 Spring St Unit 6-7
- 6 Spring St
- 5 Spring St
- 5 Highland St
- 10 Spring St
- 2 Spring St
- 104 Spring St Unit 7
- 104 Spring St Unit 1
- 104 Spring St Unit 8
- 104 Spring St Unit 9
- 104 Spring St Unit 5
- 8 Spring St
- 15 Carolina St
- 3 Spring St
- 14 Spring St
- 11 Carolina St
- 12 Spring St
- 1 Spring St
Your Personal Tour Guide
Ask me questions while you tour the home.