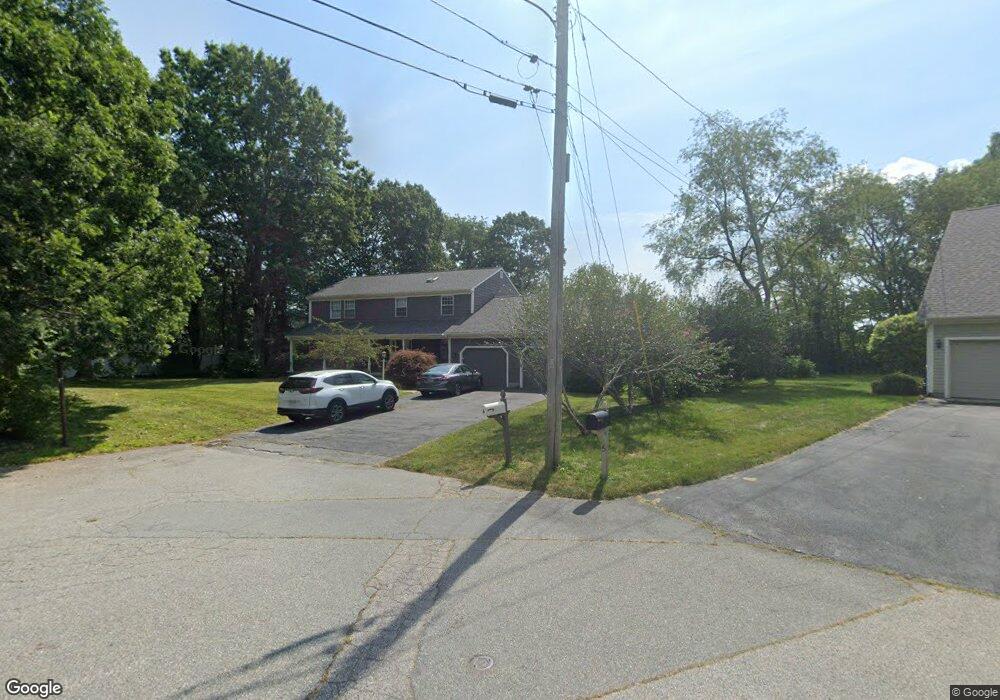
6 Abby Rd Barrington, RI 02806
North Barrington NeighborhoodEstimated Value: $1,093,949 - $1,465,000
4
Beds
3
Baths
2,950
Sq Ft
$411/Sq Ft
Est. Value
About This Home
This home is located at 6 Abby Rd, Barrington, RI 02806 and is currently estimated at $1,210,987, approximately $410 per square foot. 6 Abby Rd is a home located in Bristol County with nearby schools including Barrington High School, Barrington Christian Academy, and St. Andrews School.
Ownership History
Date
Name
Owned For
Owner Type
Purchase Details
Closed on
Dec 19, 2007
Sold by
Stiness John and Stiness Kelly
Bought by
Kanterman Vlad and Kanterman Kathryn
Current Estimated Value
Home Financials for this Owner
Home Financials are based on the most recent Mortgage that was taken out on this home.
Original Mortgage
$100,000
Interest Rate
5.95%
Mortgage Type
Purchase Money Mortgage
Purchase Details
Closed on
Aug 29, 1997
Sold by
Charzewski David L and Charzewski Clare
Bought by
Stiness John H and Stiness Kelley
Purchase Details
Closed on
Sep 1, 1995
Sold by
Loiselle Roy T and Loiselle Dolores
Bought by
Charzewski David L and Charzewski Clare
Purchase Details
Closed on
Mar 30, 1989
Sold by
Parillo Joseph
Bought by
Loiselle Roy
Create a Home Valuation Report for This Property
The Home Valuation Report is an in-depth analysis detailing your home's value as well as a comparison with similar homes in the area
Home Values in the Area
Average Home Value in this Area
Purchase History
| Date | Buyer | Sale Price | Title Company |
|---|---|---|---|
| Kanterman Vlad | $549,000 | -- | |
| Stiness John H | $250,000 | -- | |
| Charzewski David L | $240,000 | -- | |
| Loiselle Roy | $3,000 | -- | |
| Loiselle Roy | $3,000 | -- |
Source: Public Records
Mortgage History
| Date | Status | Borrower | Loan Amount |
|---|---|---|---|
| Closed | Loiselle Roy | $83,000 | |
| Closed | Loiselle Roy | $50,000 | |
| Closed | Loiselle Roy | $100,000 |
Source: Public Records
Tax History Compared to Growth
Tax History
| Year | Tax Paid | Tax Assessment Tax Assessment Total Assessment is a certain percentage of the fair market value that is determined by local assessors to be the total taxable value of land and additions on the property. | Land | Improvement |
|---|---|---|---|---|
| 2025 | $12,517 | $816,000 | $259,000 | $557,000 |
| 2024 | $12,036 | $816,000 | $259,000 | $557,000 |
| 2023 | $11,185 | $551,000 | $175,000 | $376,000 |
| 2022 | $10,827 | $551,000 | $175,000 | $376,000 |
| 2021 | $10,552 | $551,000 | $175,000 | $376,000 |
| 2020 | $10,178 | $487,000 | $148,000 | $339,000 |
| 2019 | $9,789 | $487,000 | $148,000 | $339,000 |
| 2018 | $9,497 | $487,000 | $148,000 | $339,000 |
| 2017 | $9,790 | $489,500 | $147,000 | $342,500 |
| 2016 | $9,031 | $489,500 | $147,000 | $342,500 |
| 2015 | $8,933 | $489,500 | $147,000 | $342,500 |
| 2014 | $9,040 | $494,000 | $150,000 | $344,000 |
Source: Public Records
Map
Nearby Homes