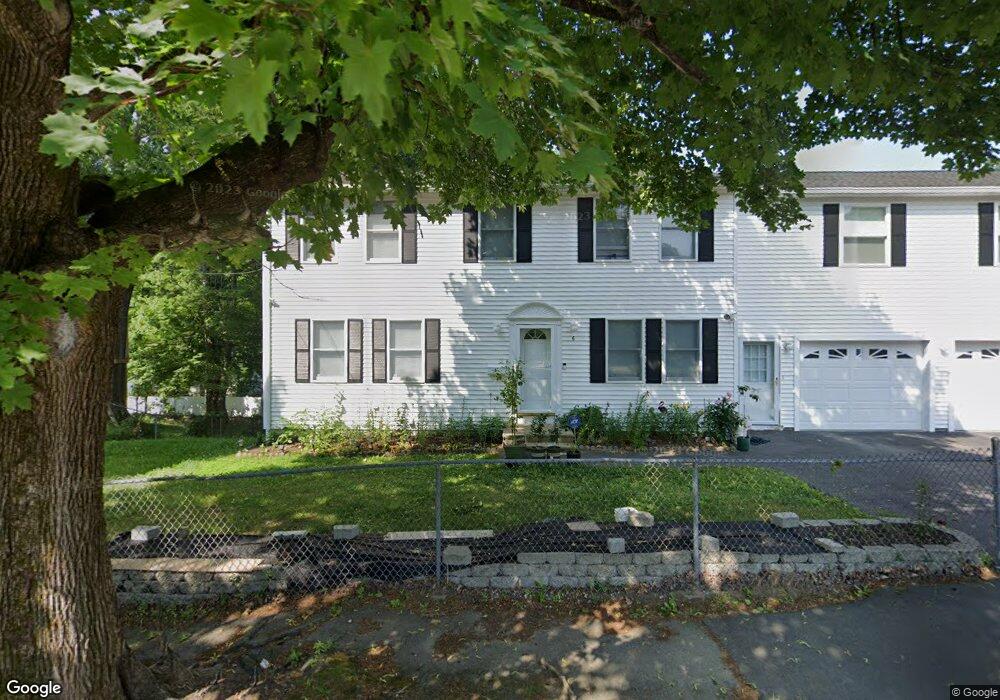
6 Abington St Worcester, MA 01603
Webster Square NeighborhoodEstimated Value: $471,000 - $660,000
3
Beds
2
Baths
1,870
Sq Ft
$303/Sq Ft
Est. Value
About This Home
This home is located at 6 Abington St, Worcester, MA 01603 and is currently estimated at $566,000, approximately $302 per square foot. 6 Abington St is a home located in Worcester County with nearby schools including Jacob Hiatt Magnet School, Chandler Magnet, and Heard Street Discovery Academy.
Ownership History
Date
Name
Owned For
Owner Type
Purchase Details
Closed on
Jun 6, 2000
Sold by
Szafarowicz Mark
Bought by
Cao Tan and Nguyen Diem H
Current Estimated Value
Home Financials for this Owner
Home Financials are based on the most recent Mortgage that was taken out on this home.
Original Mortgage
$119,900
Interest Rate
8.14%
Mortgage Type
Purchase Money Mortgage
Purchase Details
Closed on
Aug 26, 1997
Sold by
Poole Philip A and Poole Janice K
Bought by
Szafarowicz Mark
Create a Home Valuation Report for This Property
The Home Valuation Report is an in-depth analysis detailing your home's value as well as a comparison with similar homes in the area
Home Values in the Area
Average Home Value in this Area
Purchase History
| Date | Buyer | Sale Price | Title Company |
|---|---|---|---|
| Cao Tan | $149,900 | -- | |
| Szafarowicz Mark | $17,000 | -- |
Source: Public Records
Mortgage History
| Date | Status | Borrower | Loan Amount |
|---|---|---|---|
| Open | Szafarowicz Mark | $116,000 | |
| Closed | Szafarowicz Mark | $119,900 | |
| Previous Owner | Szafarowicz Mark | $74,750 |
Source: Public Records
Tax History Compared to Growth
Tax History
| Year | Tax Paid | Tax Assessment Tax Assessment Total Assessment is a certain percentage of the fair market value that is determined by local assessors to be the total taxable value of land and additions on the property. | Land | Improvement |
|---|---|---|---|---|
| 2025 | $7,588 | $575,300 | $97,600 | $477,700 |
| 2024 | $7,352 | $534,700 | $97,600 | $437,100 |
| 2023 | $7,121 | $496,600 | $84,800 | $411,800 |
| 2022 | $6,641 | $436,600 | $67,900 | $368,700 |
| 2021 | $6,631 | $407,300 | $54,300 | $353,000 |
| 2020 | $6,409 | $377,000 | $53,900 | $323,100 |
| 2019 | $6,145 | $341,400 | $47,000 | $294,400 |
| 2018 | $6,051 | $320,000 | $47,000 | $273,000 |
| 2017 | $6,033 | $313,900 | $47,000 | $266,900 |
| 2016 | $5,730 | $278,000 | $33,200 | $244,800 |
| 2015 | $4,572 | $227,800 | $33,200 | $194,600 |
| 2014 | $4,002 | $204,800 | $33,200 | $171,600 |
Source: Public Records
Map
Nearby Homes
- 170 Stafford St
- 22 Lanark St
- 13 Merchant St
- 27 Havana Rd
- 315 Stafford St
- 1511 Main St Unit C405
- 1511 Main St Unit C306
- 26 Sylvan St
- 76 Parsons Hill Dr Unit A
- 15 Teddy Rd
- 128 Wildwood Ave
- 25 Wyola Dr
- 19 Monticello Dr
- 2 Montague St
- 11 Timrod Dr
- 31 B Gates Rd Unit 22R
- 23 Lakewood St
- 176 Boyce St
- 191 Boyce St
- 177 Boyce St
- 6 Falcon St
- 4 Falcon St
- 8 Falcon St
- 5 Abington St
- 3 Abington St
- 7 Abington St
- 1 Abington St
- 2 Abington St
- 2 Abington St
- 2 Falcon St
- 9 Abington St
- 10 Falcon St
- 12 Abington St
- 210 Stafford St
- 204 Stafford St
- 202 Stafford St Unit 1
- 202 Stafford St
- 202 Stafford St Unit 3
- 3 Victor Ave
- 3 Victor Ave Unit 2