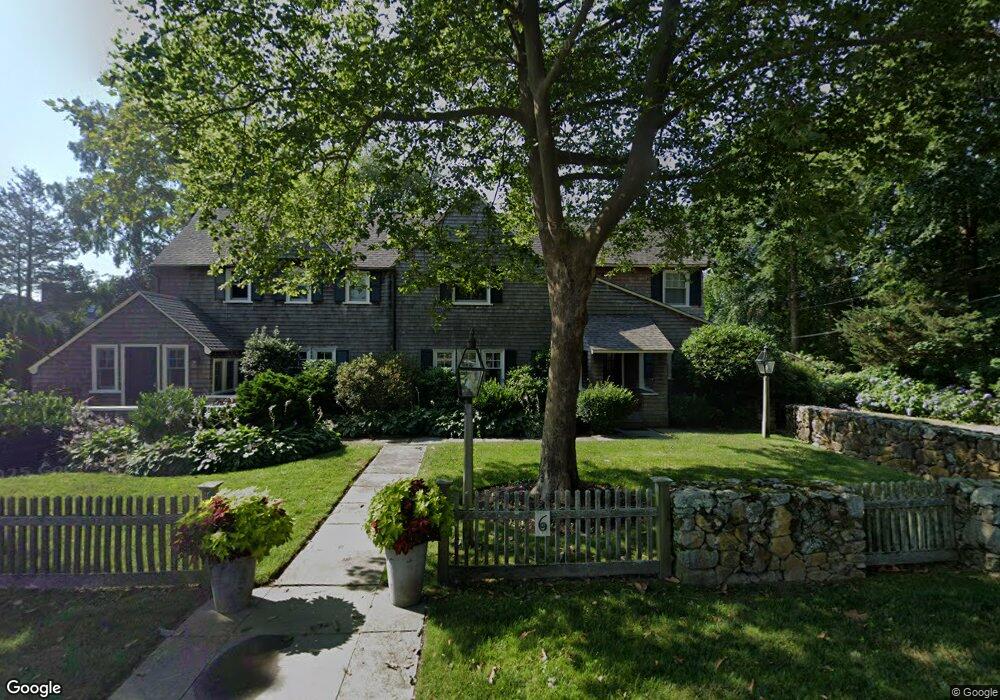
6 Allen St Marion, MA 02738
Marion Center NeighborhoodEstimated Value: $1,649,000 - $2,371,024
5
Beds
4
Baths
3,695
Sq Ft
$562/Sq Ft
Est. Value
About This Home
This home is located at 6 Allen St, Marion, MA 02738 and is currently estimated at $2,074,756, approximately $561 per square foot. 6 Allen St is a home located in Plymouth County with nearby schools including Old Rochester Regional High School and Tabor Academy.
Ownership History
Date
Name
Owned For
Owner Type
Purchase Details
Closed on
Jan 15, 2019
Sold by
Lucas Anne G
Bought by
Richard E Lucas 2019 T E and Richard Lucas
Current Estimated Value
Purchase Details
Closed on
Apr 6, 2006
Sold by
Kehoe Michael A
Bought by
Lucas Anne G
Purchase Details
Closed on
Sep 16, 1996
Sold by
Crocker Mary Jb and Crocker Prescott B
Bought by
Grover Paul E and Grover Lisa P
Create a Home Valuation Report for This Property
The Home Valuation Report is an in-depth analysis detailing your home's value as well as a comparison with similar homes in the area
Home Values in the Area
Average Home Value in this Area
Purchase History
| Date | Buyer | Sale Price | Title Company |
|---|---|---|---|
| Richard E Lucas 2019 T E | -- | -- | |
| Lucas Anne G | -- | -- | |
| Grover Paul E | $435,000 | -- |
Source: Public Records
Mortgage History
| Date | Status | Borrower | Loan Amount |
|---|---|---|---|
| Previous Owner | Grover Paul E | $943,000 | |
| Previous Owner | Grover Paul E | $340,000 | |
| Previous Owner | Grover Paul E | $500,000 |
Source: Public Records
Tax History Compared to Growth
Tax History
| Year | Tax Paid | Tax Assessment Tax Assessment Total Assessment is a certain percentage of the fair market value that is determined by local assessors to be the total taxable value of land and additions on the property. | Land | Improvement |
|---|---|---|---|---|
| 2025 | $17,936 | $1,924,472 | $889,272 | $1,035,200 |
| 2024 | $17,821 | $1,924,472 | $889,272 | $1,035,200 |
| 2023 | $18,172 | $1,924,968 | $839,868 | $1,085,100 |
| 2022 | $14,703 | $1,355,153 | $604,553 | $750,600 |
| 2021 | $13,362 | $1,180,380 | $512,980 | $667,400 |
| 2020 | $13,290 | $1,135,900 | $512,900 | $623,000 |
| 2019 | $12,529 | $1,135,900 | $512,900 | $623,000 |
| 2018 | $16,009 | $1,398,200 | $763,500 | $634,700 |
| 2017 | $15,953 | $1,398,200 | $763,500 | $634,700 |
| 2016 | $15,069 | $1,332,400 | $763,500 | $568,900 |
| 2015 | $14,195 | $1,277,700 | $709,700 | $568,000 |
Source: Public Records
Map
Nearby Homes