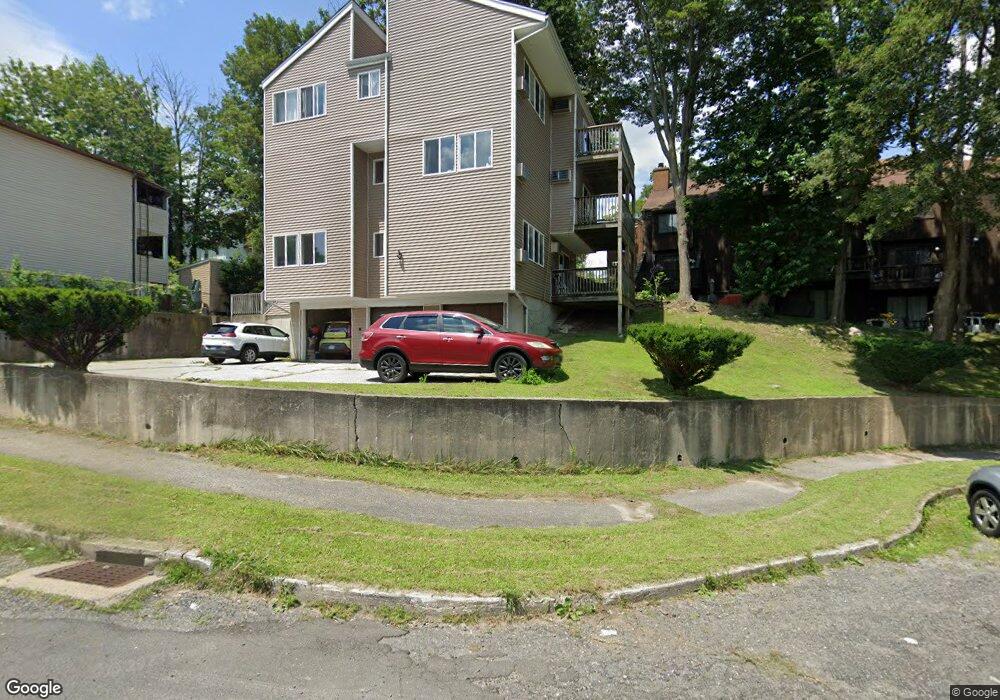
6 Ann Dr Unit A Danbury, CT 06810
Estimated Value: $208,000 - $293,000
2
Beds
1
Bath
956
Sq Ft
$266/Sq Ft
Est. Value
About This Home
This home is located at 6 Ann Dr Unit A, Danbury, CT 06810 and is currently estimated at $254,672, approximately $266 per square foot. 6 Ann Dr Unit A is a home located in Fairfield County with nearby schools including Morris Street Elementary School, Rogers Park Middle School, and Danbury High School.
Ownership History
Date
Name
Owned For
Owner Type
Purchase Details
Closed on
Apr 14, 2010
Sold by
Johnson Carl W Est
Bought by
Cordero David and Droz Sandra
Current Estimated Value
Home Financials for this Owner
Home Financials are based on the most recent Mortgage that was taken out on this home.
Original Mortgage
$112,450
Outstanding Balance
$74,784
Interest Rate
4.97%
Estimated Equity
$179,888
Purchase Details
Closed on
Nov 4, 1992
Sold by
Boardman Nancy
Bought by
American Sb
Create a Home Valuation Report for This Property
The Home Valuation Report is an in-depth analysis detailing your home's value as well as a comparison with similar homes in the area
Home Values in the Area
Average Home Value in this Area
Purchase History
| Date | Buyer | Sale Price | Title Company |
|---|---|---|---|
| Cordero David | $125,000 | -- | |
| American Sb | $84,000 | -- |
Source: Public Records
Mortgage History
| Date | Status | Borrower | Loan Amount |
|---|---|---|---|
| Open | American Sb | $112,450 |
Source: Public Records
Tax History Compared to Growth
Tax History
| Year | Tax Paid | Tax Assessment Tax Assessment Total Assessment is a certain percentage of the fair market value that is determined by local assessors to be the total taxable value of land and additions on the property. | Land | Improvement |
|---|---|---|---|---|
| 2025 | $2,468 | $98,770 | $0 | $98,770 |
| 2024 | $2,414 | $98,770 | $0 | $98,770 |
| 2023 | $2,304 | $98,770 | $0 | $98,770 |
| 2022 | $2,354 | $83,400 | $0 | $83,400 |
| 2021 | $2,302 | $83,400 | $0 | $83,400 |
| 2020 | $2,302 | $83,400 | $0 | $83,400 |
| 2019 | $2,302 | $83,400 | $0 | $83,400 |
| 2018 | $2,302 | $83,400 | $0 | $83,400 |
| 2017 | $2,478 | $85,600 | $0 | $85,600 |
| 2016 | $2,455 | $85,600 | $0 | $85,600 |
| 2015 | $2,419 | $85,600 | $0 | $85,600 |
| 2014 | $2,363 | $85,600 | $0 | $85,600 |
Source: Public Records
Map
Nearby Homes