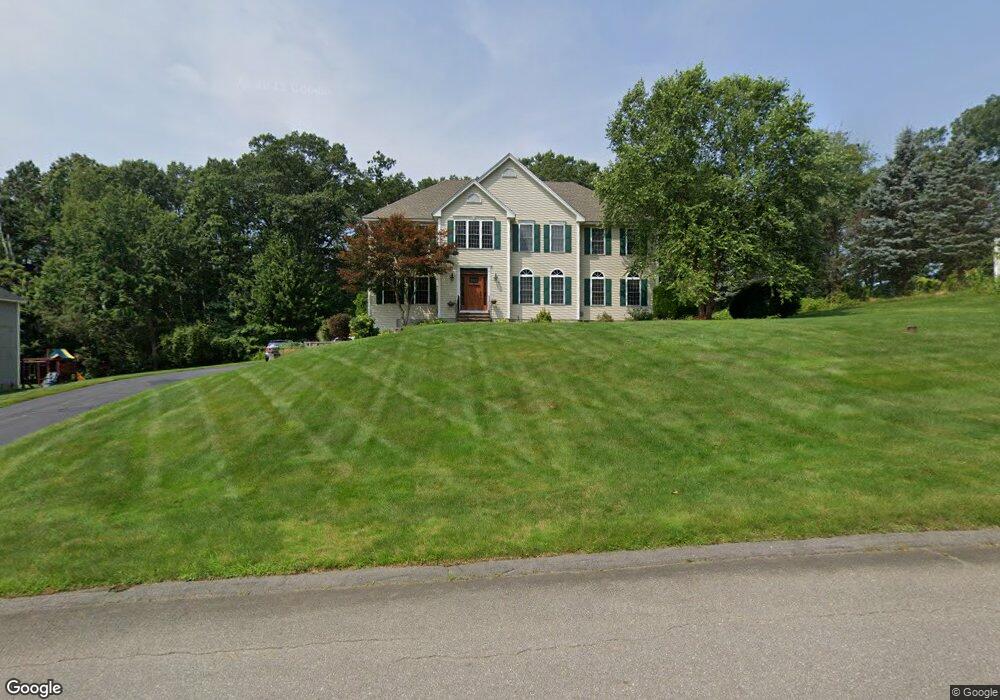
6 Appleton Rd Windham, NH 03087
Estimated Value: $1,091,704 - $1,343,000
3
Beds
4
Baths
3,384
Sq Ft
$358/Sq Ft
Est. Value
About This Home
This home is located at 6 Appleton Rd, Windham, NH 03087 and is currently estimated at $1,212,426, approximately $358 per square foot. 6 Appleton Rd is a home located in Rockingham County with nearby schools including Golden Brook Elementary School, Windham Middle School, and Windham High School.
Ownership History
Date
Name
Owned For
Owner Type
Purchase Details
Closed on
Apr 21, 2004
Sold by
Mt Home Bldg Contracto
Bought by
Piazza John F and Piazza Angelyn
Current Estimated Value
Home Financials for this Owner
Home Financials are based on the most recent Mortgage that was taken out on this home.
Original Mortgage
$380,000
Interest Rate
5.4%
Mortgage Type
Purchase Money Mortgage
Create a Home Valuation Report for This Property
The Home Valuation Report is an in-depth analysis detailing your home's value as well as a comparison with similar homes in the area
Home Values in the Area
Average Home Value in this Area
Purchase History
| Date | Buyer | Sale Price | Title Company |
|---|---|---|---|
| Piazza John F | $580,000 | -- |
Source: Public Records
Mortgage History
| Date | Status | Borrower | Loan Amount |
|---|---|---|---|
| Open | Piazza John F | $332,000 | |
| Closed | Piazza John F | $354,000 | |
| Closed | Piazza John F | $380,000 |
Source: Public Records
Tax History
| Year | Tax Paid | Tax Assessment Tax Assessment Total Assessment is a certain percentage of the fair market value that is determined by local assessors to be the total taxable value of land and additions on the property. | Land | Improvement |
|---|---|---|---|---|
| 2024 | $14,503 | $640,600 | $168,700 | $471,900 |
| 2023 | $13,709 | $640,600 | $168,700 | $471,900 |
| 2022 | $12,658 | $640,600 | $168,700 | $471,900 |
| 2021 | $11,453 | $615,100 | $168,700 | $446,400 |
| 2020 | $11,767 | $615,100 | $168,700 | $446,400 |
| 2019 | $11,162 | $495,000 | $155,500 | $339,500 |
| 2018 | $11,529 | $495,000 | $155,500 | $339,500 |
| 2017 | $9,999 | $495,000 | $155,500 | $339,500 |
| 2016 | $10,801 | $495,000 | $155,500 | $339,500 |
| 2015 | $10,914 | $502,500 | $155,500 | $347,000 |
| 2014 | $10,913 | $454,700 | $166,000 | $288,700 |
| 2013 | $11,134 | $471,800 | $166,000 | $305,800 |
Source: Public Records
Map
Nearby Homes
- 108 S Shore Rd
- 5 Johnson St
- 6-18 Mary Anthony Dr
- 6 Chadwick Cir
- 47 Cobbetts Pond Rd
- 48 Marblehead Rd
- 54 Enterprise Dr
- 144 N Policy St
- 11 Sullivan Ct
- 47 Campbell St
- 92 Lowell Rd
- 30 Main St
- 56 Nelson St
- 4 Rosemary St
- 30 Winter St
- 18 Winter St
- 75 S Policy St Unit 45
- 10 Millville St
- 4 Arbor Rd
- 16 Arbor Rd
Your Personal Tour Guide
Ask me questions while you tour the home.