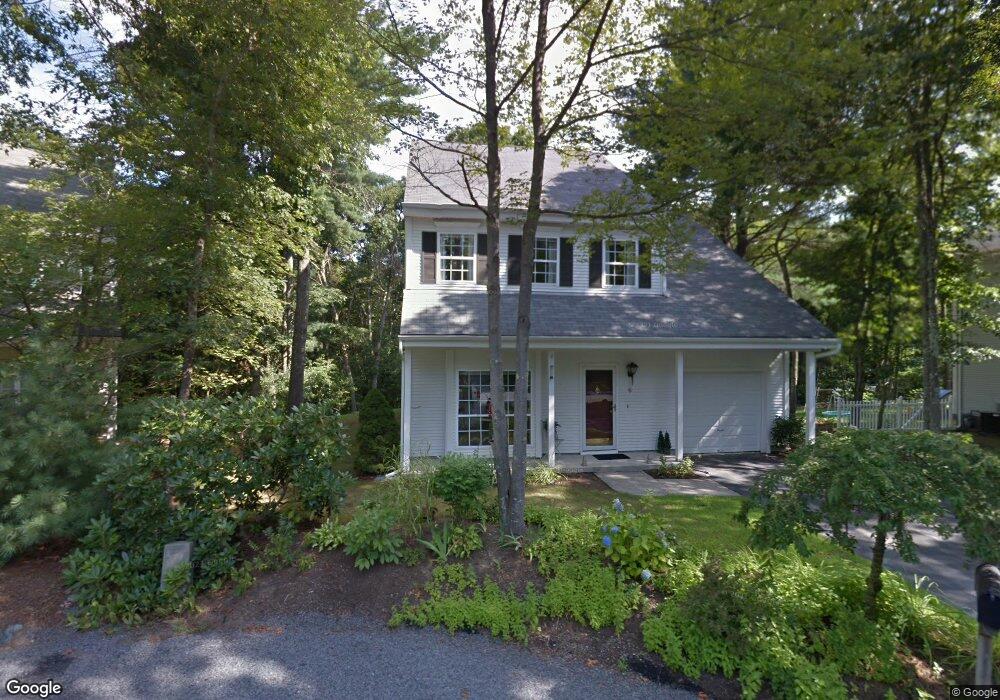
6 Balcom Dr Foxboro, MA 02035
Estimated Value: $683,000 - $773,000
2
Beds
3
Baths
1,800
Sq Ft
$393/Sq Ft
Est. Value
About This Home
This home is located at 6 Balcom Dr, Foxboro, MA 02035 and is currently estimated at $708,085, approximately $393 per square foot. 6 Balcom Dr is a home located in Norfolk County with nearby schools including Foxborough High School, Foxborough Regional Charter School, and The Sage School.
Ownership History
Date
Name
Owned For
Owner Type
Purchase Details
Closed on
Jun 3, 2019
Sold by
Resker Margaret D
Bought by
Balcom Drive 6 Rt
Current Estimated Value
Purchase Details
Closed on
May 4, 2000
Sold by
Moore Martin N and Moore Wendy L
Bought by
Resker Margaret D
Purchase Details
Closed on
Jul 2, 1998
Sold by
Pereira Raymond W and Pereira Helga
Bought by
Moore Martin N and Moore Wendy L
Home Financials for this Owner
Home Financials are based on the most recent Mortgage that was taken out on this home.
Original Mortgage
$181,925
Interest Rate
7.04%
Mortgage Type
Purchase Money Mortgage
Purchase Details
Closed on
Jan 4, 1993
Sold by
Summerfield Inc
Bought by
Pereira Raymond W and Pereira Helga
Home Financials for this Owner
Home Financials are based on the most recent Mortgage that was taken out on this home.
Original Mortgage
$90,000
Interest Rate
8.32%
Mortgage Type
Purchase Money Mortgage
Create a Home Valuation Report for This Property
The Home Valuation Report is an in-depth analysis detailing your home's value as well as a comparison with similar homes in the area
Home Values in the Area
Average Home Value in this Area
Purchase History
We collect this data history from publicly available records. To have your information removed, we recommend requesting removal directly through your county’s website.
| Date | Buyer | Sale Price | Title Company |
|---|---|---|---|
| Balcom Drive 6 Rt | -- | -- | |
| Resker Margaret D | $239,900 | -- | |
| Moore Martin N | $191,500 | -- | |
| Pereira Raymond W | $161,365 | -- |
Source: Public Records
Mortgage History
We collect this data history from publicly available records. To have your information removed, we recommend requesting removal directly through your county’s website.
| Date | Status | Borrower | Loan Amount |
|---|---|---|---|
| Previous Owner | Pereira Raymond W | $181,925 | |
| Previous Owner | Pereira Raymond W | $90,000 |
Source: Public Records
Tax History
| Year | Tax Paid | Tax Assessment Tax Assessment Total Assessment is a certain percentage of the fair market value that is determined by local assessors to be the total taxable value of land and additions on the property. | Land | Improvement |
|---|---|---|---|---|
| 2025 | $6,955 | $526,100 | $220,400 | $305,700 |
| 2024 | $6,936 | $513,400 | $224,400 | $289,000 |
| 2023 | $6,699 | $471,400 | $213,700 | $257,700 |
| 2022 | $6,142 | $423,000 | $179,200 | $243,800 |
| 2021 | $5,981 | $405,800 | $166,000 | $239,800 |
| 2020 | $5,796 | $397,800 | $166,000 | $231,800 |
| 2019 | $5,496 | $373,900 | $158,100 | $215,800 |
| 2018 | $5,443 | $373,600 | $158,100 | $215,500 |
| 2017 | $5,243 | $348,600 | $147,700 | $200,900 |
| 2016 | $5,151 | $347,600 | $148,900 | $198,700 |
| 2015 | $5,087 | $334,900 | $125,900 | $209,000 |
| 2014 | $4,836 | $322,600 | $117,700 | $204,900 |
Source: Public Records
Map
Nearby Homes
- 9 Grover Ln
- 160 East St
- Lot One Old Wolomolopoag St
- Lot Two Old Wolomolopoag St
- 31 Atherton Rd
- 68 Alden St
- 15 Boyden Dr
- 52 Morse St
- 8 Weyman Ln
- 11 Cow Hill Rd
- 6 Osprey Rd
- 147 Chestnut St Unit A
- 147 Chestnut St Unit B
- 15 Wadsworth Way
- 214 Mechanic St
- 8 Windsor Dr
- 109 Cocasset St
- 11 Windsor Dr
- 12 Elm St
- 1 Tamworth Rd
Your Personal Tour Guide
Ask me questions while you tour the home.