NOT LISTED FOR SALE

6 Baltimore Ave Glen Burnie, MD 21061

Estimated Value: $343,000 - $419,000

4 Beds
2 Baths
1,080 Sq Ft
$358/Sq Ft Est. Value

Last Sold June 15, 2012

Last sale price $218,000 $202 Per Sq Ft

Est. 78% increase in value since last sale

Current estimated payment $2,294/month

About This Home

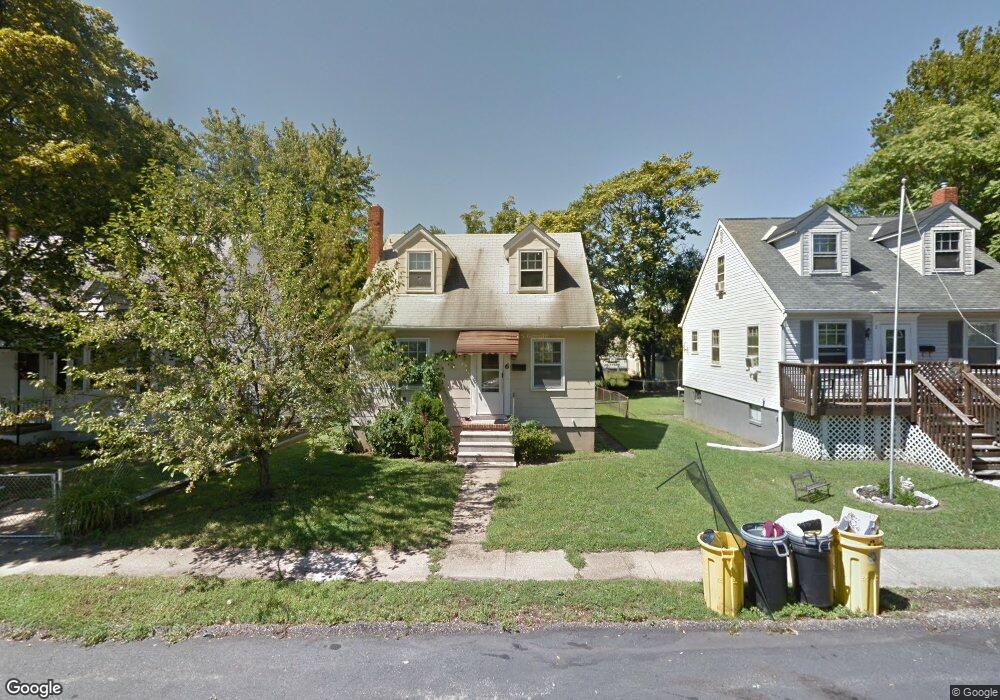
Cute as a button is what you call this home! Totally rehabbed cape cod on tree lined street in the Ferndale Farms area of Glen Burnie. Partially fenced back yard leads to room for expansion and kids playing. Large unfinished basement is a blank slate for upgrades and additional living space. Complete with granite countertops, maple cabinetry and stainless steel appliances. Make appt. today.

Ownership History

Date Name Owned For Owner Type

Purchase Details

Listed on
May 1, 2012
Closed on
Jun 15, 2012
Sold by
Westendorf Elizabeth K and Estate Of Stanley F Westendorf
Bought by
Higgins Theresa M
Seller's Agent
Nicki Hubers-Hall
Douglas Realty, LLC
Buyer's Agent
Terry Feeheley
RE/MAX Executive
List Price
$230,000
Sold Price
$218,000
Premium/Discount to List
-$12,000
-5.22%
Current Estimated Value
$387,077

Home Financials for this Owner

Home Financials are based on the most recent Mortgage that was taken out on this home.
Estimated Appreciation
$169,077
Avg. Annual Appreciation
4.35%
Source: Public Records

Range of Values:

--
Value Increase
--
Percent Increase
--
Adjusted for Inflation
Collateral Analytics

Collateral Analytics Collateral Analytics AVMs (Automated Valuation Model) employ a number of statistical approaches combined with neighborhood-specific comparable selection guarantees the most up-to-date and precise valuations.

Not Available

Collateral Analytics does not have data for the current month. Please view the chart for historical values.

ICE

ICE Mortgage Technology ICE Mortgage Technology’s AVM (Automated Valuation Model) is a state-of-the-art online residential property valuation tool that provides a quick and accurate estimate of the value of almost any home in the U.S.

Not Available

ICE Mortgage Technology does not have data for the current month. Please view the chart for historical values.

First American

First American First American Data & Analytics’ next-generation AVM combines unrivaled data assets with a blended ensemble of valuation models to produce highly accurate, reliable valuations you can trust.

Not Available

First American does not have data for the current month. Please view the chart for historical values.

Quantarium

Quantarium Quantarium’s valuation service, repeatedly proven the industry’s most accurate and comprehensive, is supercharged with a self-learning and auto-tuning AI engine that continually becomes smarter and more accurate as it processes daily inputs from the industry’s leading RE data lake.

Not Available

Quantarium does not have data for the current month. Please view the chart for historical values.

Average Value
Not Available
List Price
Sold Price
Create a Home Valuation Report for This Property
The Home Valuation Report is an in-depth analysis detailing your home's value as well as a comparison with similar homes in the area

Home Values in the Area

Source: Public Records

Average Home Value in this Area


Source: Public Records

Purchase History

Date Buyer Sale Price Title Company
Higgins Theresa M $109,000 Lakeside Title Company
Source: Public Records

Property History

Date Event Price List to Sale Price per Sq Ft Prior Sale
06/15/2012 06/15/12 Sold $218,000 -5.2% $202 / Sq Ft View Prior Sale
05/26/2012 05/26/12 Pending -- -- --
05/10/2012 05/10/12 For Sale $230,000 +5.5% $213 / Sq Ft
05/09/2012 05/09/12 Off Market $218,000 -- --
05/01/2012 05/01/12 For Sale $230,000 -- $213 / Sq Ft

Tax History Compared to Growth

Source: Public Records

Tax History

Year Tax Paid Tax Assessment Tax Assessment Total Assessment is a certain percentage of the fair market value that is determined by local assessors to be the total taxable value of land and additions on the property. Land Improvement
2025 $3,076 $316,100 $151,400 $164,700
2024 $3,076 $300,033 $0 $0
2023 $2,979 $283,967 $0 $0
2022 $2,772 $267,900 $131,400 $136,500
2021 $2,620 $253,833 $0 $0
2020 $2,620 $239,767 $0 $0
2019 $2,568 $225,700 $131,400 $94,300
2018 $2,270 $223,867 $0 $0
2017 $2,429 $222,033 $0 $0
2016 -- $220,200 $0 $0
2015 -- $207,833 $0 $0
2014 -- $195,467 $0 $0
Source: Public Records

Agents Affiliated with this Home

  • Section Image
  • Section Image
See All Agents

Map