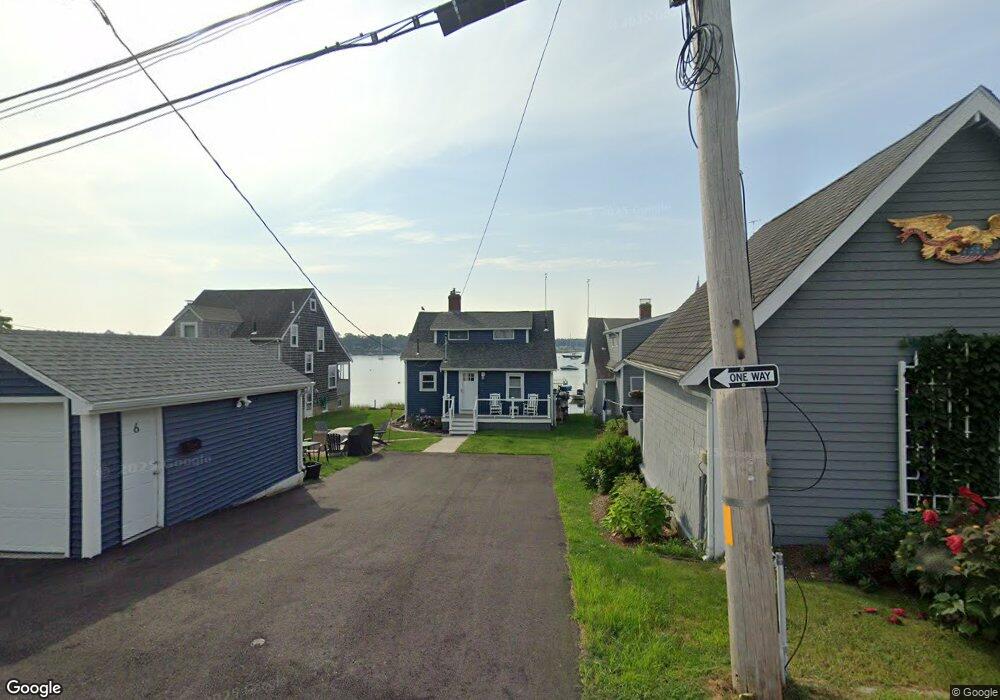
6 Barnacle Rd Wareham, MA 02571
Wareham Center NeighborhoodEstimated Value: $479,000 - $648,000
3
Beds
1
Bath
1,268
Sq Ft
$454/Sq Ft
Est. Value
About This Home
This home is located at 6 Barnacle Rd, Wareham, MA 02571 and is currently estimated at $575,707, approximately $454 per square foot. 6 Barnacle Rd is a home located in Plymouth County.
Ownership History
Date
Name
Owned For
Owner Type
Purchase Details
Closed on
May 31, 2022
Sold by
Boreri Marjorie J
Bought by
Raposo Claudio D and Raposo Alicia C
Current Estimated Value
Home Financials for this Owner
Home Financials are based on the most recent Mortgage that was taken out on this home.
Original Mortgage
$350,000
Outstanding Balance
$331,584
Interest Rate
5.11%
Mortgage Type
Purchase Money Mortgage
Estimated Equity
$244,123
Create a Home Valuation Report for This Property
The Home Valuation Report is an in-depth analysis detailing your home's value as well as a comparison with similar homes in the area
Home Values in the Area
Average Home Value in this Area
Purchase History
| Date | Buyer | Sale Price | Title Company |
|---|---|---|---|
| Raposo Claudio D | $350,000 | None Available | |
| Raposo Claudio D | $350,000 | None Available |
Source: Public Records
Mortgage History
| Date | Status | Borrower | Loan Amount |
|---|---|---|---|
| Open | Raposo Claudio D | $350,000 | |
| Closed | Raposo Claudio D | $350,000 |
Source: Public Records
Tax History
| Year | Tax Paid | Tax Assessment Tax Assessment Total Assessment is a certain percentage of the fair market value that is determined by local assessors to be the total taxable value of land and additions on the property. | Land | Improvement |
|---|---|---|---|---|
| 2025 | $5,618 | $539,200 | $279,300 | $259,900 |
| 2024 | $5,168 | $460,200 | $213,400 | $246,800 |
| 2023 | $4,816 | $411,200 | $193,800 | $217,400 |
| 2022 | $4,816 | $365,400 | $193,800 | $171,600 |
| 2021 | $4,807 | $357,400 | $193,800 | $163,600 |
| 2020 | $4,633 | $349,400 | $193,800 | $155,600 |
| 2019 | $4,063 | $305,700 | $162,300 | $143,400 |
| 2018 | $3,887 | $285,200 | $162,300 | $122,900 |
| 2017 | $3,767 | $280,100 | $162,300 | $117,800 |
| 2016 | $3,573 | $264,100 | $154,000 | $110,100 |
| 2015 | $3,452 | $264,100 | $154,000 | $110,100 |
| 2014 | $3,017 | $234,800 | $143,300 | $91,500 |
Source: Public Records
Map
Nearby Homes
- 1 Nimrod Way
- 10 Oak St
- 15 Broadmarsh Ave
- 6 Allen Ave
- 20 Grant St
- 43 Shore Ave
- 12 Oakdale St
- 21 Bayview St
- 10 Barnes St
- 110 Mayflower Ridge Dr
- 10 Longmeadow Dr
- 6 Bourne Terrace
- 437 Main St
- 58 Shady Ln
- 156 Sandwich Rd
- 233 Marion Rd
- 2697 Cranberry Hwy Unit 21
- 2743 Cranberry Hwy Unit 5D
- 7 Cranberry Ln
- 2645 Cranberry Hwy Unit A
Your Personal Tour Guide
Ask me questions while you tour the home.