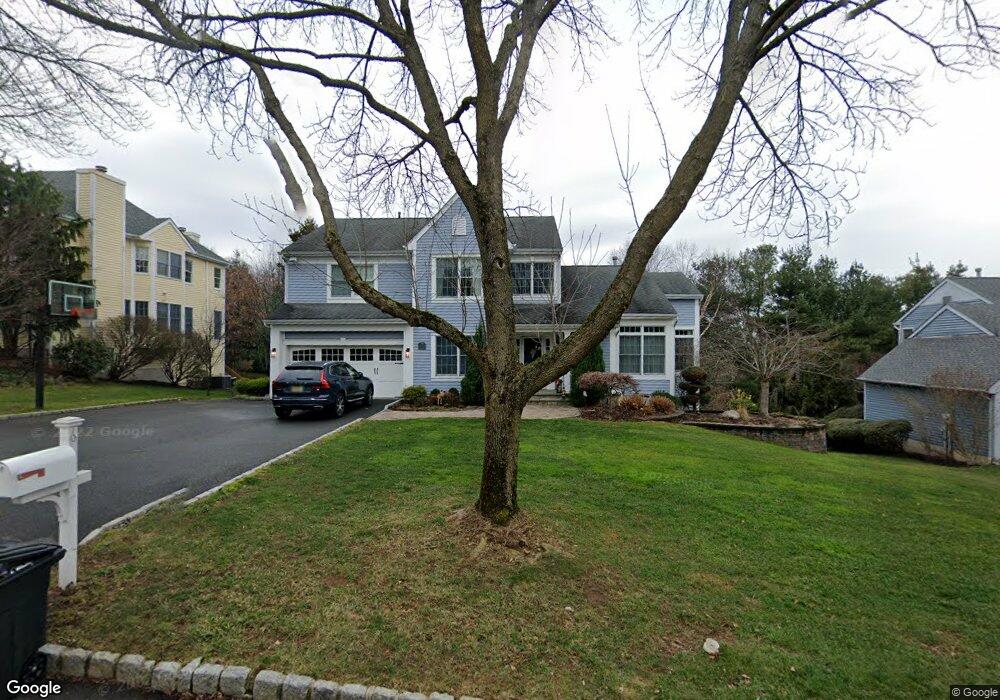
6 Barnstable Rd Berkeley Heights, NJ 07922
Estimated Value: $1,213,757 - $1,835,000
Studio
--
Bath
3,147
Sq Ft
$486/Sq Ft
Est. Value
About This Home
This home is located at 6 Barnstable Rd, Berkeley Heights, NJ 07922 and is currently estimated at $1,529,189, approximately $485 per square foot. 6 Barnstable Rd is a home located in Union County with nearby schools including Columbia Middle School, Governor Livingston High School, and The Academy of Our Lady of Peace.
Ownership History
Date
Name
Owned For
Owner Type
Purchase Details
Closed on
Feb 7, 2019
Sold by
Schuman Robert W
Bought by
Kenefick Catherine M
Current Estimated Value
Purchase Details
Closed on
Dec 29, 1998
Sold by
Mcnamara Michael and Mcnamara Janet
Bought by
Schuman Robert W and Kenefick Catherine M
Home Financials for this Owner
Home Financials are based on the most recent Mortgage that was taken out on this home.
Original Mortgage
$492,000
Interest Rate
6.7%
Mortgage Type
Stand Alone First
Purchase Details
Closed on
Jul 30, 1998
Sold by
Porter Bell Lorraine
Bought by
Mcnamara Michael and Mcnamara Janet
Home Financials for this Owner
Home Financials are based on the most recent Mortgage that was taken out on this home.
Original Mortgage
$508,500
Interest Rate
6.92%
Purchase Details
Closed on
Oct 24, 1996
Sold by
Bell Steven and Porter Bell Lorraine
Bought by
Porter Bell Lorraine
Purchase Details
Closed on
Sep 8, 1994
Sold by
Providence Development Group Inc
Bought by
Bell Steven and Porter Bell Lorraine
Create a Home Valuation Report for This Property
The Home Valuation Report is an in-depth analysis detailing your home's value as well as a comparison with similar homes in the area
Home Values in the Area
Average Home Value in this Area
Purchase History
| Date | Buyer | Sale Price | Title Company |
|---|---|---|---|
| Kenefick Catherine M | -- | None Available | |
| Schuman Robert W | $617,000 | -- | |
| Mcnamara Michael | $565,000 | -- | |
| Porter Bell Lorraine | -- | -- | |
| Bell Steven | $417,500 | -- | |
| Providence Development Group Inc | $55,000 | -- |
Source: Public Records
Mortgage History
| Date | Status | Borrower | Loan Amount |
|---|---|---|---|
| Previous Owner | Schuman Robert W | $492,000 | |
| Previous Owner | Mcnamara Michael | $508,500 |
Source: Public Records
Tax History
| Year | Tax Paid | Tax Assessment Tax Assessment Total Assessment is a certain percentage of the fair market value that is determined by local assessors to be the total taxable value of land and additions on the property. | Land | Improvement |
|---|---|---|---|---|
| 2025 | $24,042 | $560,800 | $237,600 | $323,200 |
| 2024 | $23,694 | $560,800 | $237,600 | $323,200 |
| 2023 | $23,694 | $560,800 | $237,600 | $323,200 |
| 2022 | $23,548 | $560,800 | $237,600 | $323,200 |
| 2021 | $23,419 | $560,800 | $237,600 | $323,200 |
| 2020 | $23,542 | $560,800 | $237,600 | $323,200 |
| 2019 | $23,425 | $560,800 | $237,600 | $323,200 |
| 2018 | $22,937 | $560,800 | $237,600 | $323,200 |
| 2017 | $22,656 | $560,800 | $237,600 | $323,200 |
| 2016 | $22,258 | $560,800 | $237,600 | $323,200 |
| 2015 | $23,007 | $582,900 | $237,600 | $345,300 |
| 2014 | $22,407 | $582,900 | $237,600 | $345,300 |
Source: Public Records
Map
Nearby Homes
- 181 Maple Ave
- 142 Diamond Hill Rd
- 19 Honeyman Place
- 33 Yarmouth Dr
- 49 Pine Grove Rd
- 19 Guenevere Way Ondo
- 6
- 41 Brambling Rd
- 25 Murray Hill Square
- 57 Daria Ln
- 4B Foley Square
- 5 Murray Hill Square
- 126 Snyder Ave
- 56 Valley Rd
- 1 Murray Hill Square Unit 17A1
- 46 Coolidge Dr
- 31 Angela Way Unit 731
- 46 Snyder Ave
- 235 Plainfield Ave
- 19 Slope Dr
Your Personal Tour Guide
Ask me questions while you tour the home.