Estimated Value: $1,640,130 - $2,037,000
4
Beds
3
Baths
2,403
Sq Ft
$787/Sq Ft
Est. Value
About This Home
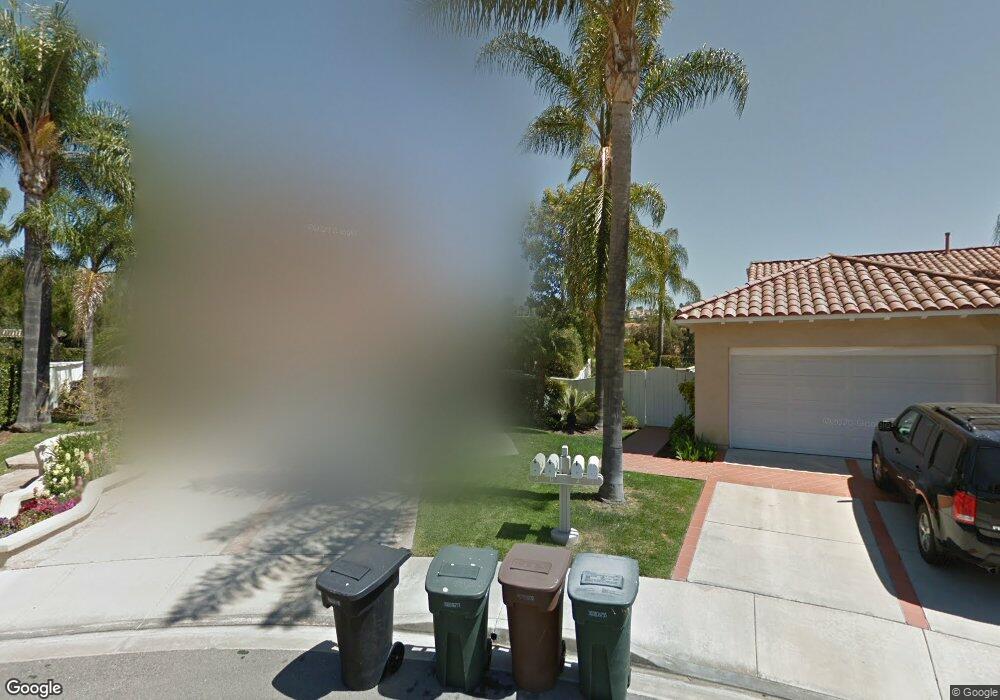
This home is located at 6 Bastia, Laguna Niguel, CA 92677 and is currently estimated at $1,890,783, approximately $786 per square foot. 6 Bastia is a home located in Orange County with nearby schools including Hidden Hills Elementary, Niguel Hills Middle School, and Dana Hills High School.
Ownership History
Date
Name
Owned For
Owner Type
Purchase Details
Closed on
Dec 30, 2005
Sold by
Beightol Brett and Beightol Sarah M
Bought by
Beightol Brett G and Beightol Sarah M
Current Estimated Value
Purchase Details
Closed on
Dec 15, 1997
Sold by
Klein Louis D and Klein Barbara Barbara
Bought by
Beightol Brett and Beightol Sarah M
Home Financials for this Owner
Home Financials are based on the most recent Mortgage that was taken out on this home.
Original Mortgage
$236,000
Outstanding Balance
$39,680
Interest Rate
7.16%
Estimated Equity
$1,851,103
Create a Home Valuation Report for This Property
The Home Valuation Report is an in-depth analysis detailing your home's value as well as a comparison with similar homes in the area
Home Values in the Area
Average Home Value in this Area
Purchase History
| Date | Buyer | Sale Price | Title Company |
|---|---|---|---|
| Beightol Brett G | -- | -- | |
| Beightol Brett | $295,000 | First American Title Ins Co |
Source: Public Records
Mortgage History
| Date | Status | Borrower | Loan Amount |
|---|---|---|---|
| Open | Beightol Brett | $236,000 | |
| Closed | Beightol Brett | $44,250 |
Source: Public Records
Tax History Compared to Growth
Tax History
| Year | Tax Paid | Tax Assessment Tax Assessment Total Assessment is a certain percentage of the fair market value that is determined by local assessors to be the total taxable value of land and additions on the property. | Land | Improvement |
|---|---|---|---|---|
| 2025 | $5,379 | $547,500 | $229,691 | $317,809 |
| 2024 | $5,379 | $536,765 | $225,187 | $311,578 |
| 2023 | $5,264 | $526,241 | $220,772 | $305,469 |
| 2022 | $5,163 | $515,923 | $216,443 | $299,480 |
| 2021 | $5,061 | $505,807 | $212,199 | $293,608 |
| 2020 | $5,011 | $500,621 | $210,023 | $290,598 |
| 2019 | $4,911 | $490,805 | $205,905 | $284,900 |
| 2018 | $4,815 | $481,182 | $201,868 | $279,314 |
| 2017 | $4,720 | $471,748 | $197,910 | $273,838 |
| 2016 | $4,628 | $462,499 | $194,030 | $268,469 |
| 2015 | $4,557 | $455,552 | $191,115 | $264,437 |
| 2014 | $4,468 | $446,629 | $187,371 | $259,258 |
Source: Public Records
Map
Nearby Homes