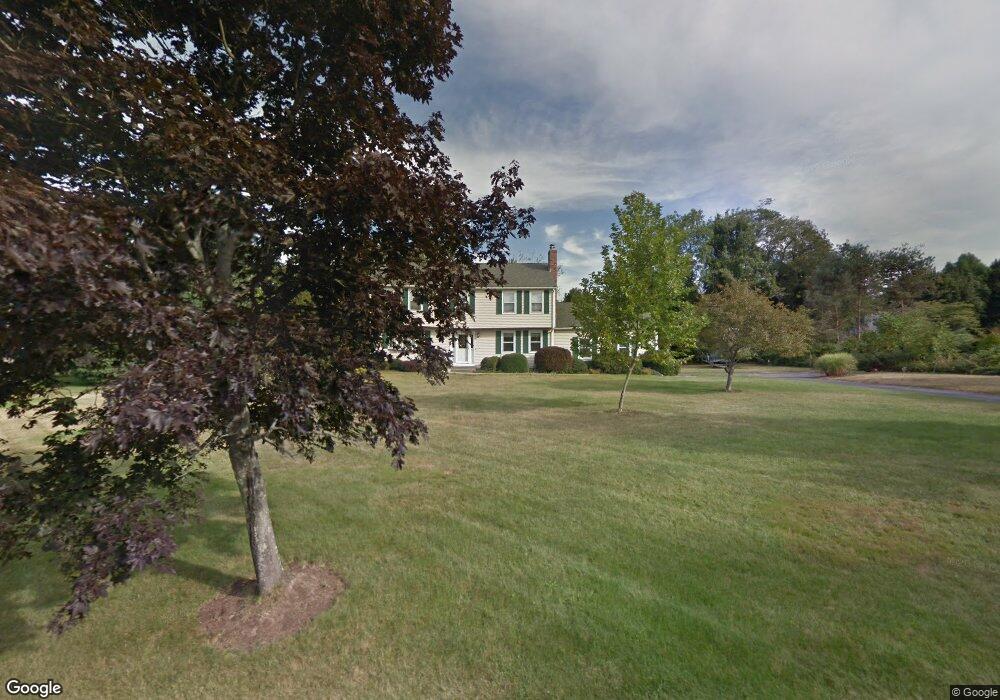
6 Bayberry St Rehoboth, MA 02769
Estimated Value: $689,000 - $865,000
4
Beds
3
Baths
2,400
Sq Ft
$322/Sq Ft
Est. Value
About This Home
This home is located at 6 Bayberry St, Rehoboth, MA 02769 and is currently estimated at $771,640, approximately $321 per square foot. 6 Bayberry St is a home located in Bristol County with nearby schools including Dighton-Rehoboth Regional High School, Highlander Charter Middle and High School, and East Bay Career Academy.
Ownership History
Date
Name
Owned For
Owner Type
Purchase Details
Closed on
Sep 19, 2024
Sold by
Kucia Thomas P and Kucia Maryanne C
Bought by
Thomas P & M C Kucia Ret and Kucia
Current Estimated Value
Purchase Details
Closed on
Sep 22, 2006
Sold by
Newton James T and Smith Corrine E
Bought by
Kucia Thomas P and Kucia Maryanne
Home Financials for this Owner
Home Financials are based on the most recent Mortgage that was taken out on this home.
Original Mortgage
$232,000
Interest Rate
6.59%
Mortgage Type
Purchase Money Mortgage
Purchase Details
Closed on
Jul 31, 1989
Sold by
Ferreira Frank
Bought by
Newton James T
Create a Home Valuation Report for This Property
The Home Valuation Report is an in-depth analysis detailing your home's value as well as a comparison with similar homes in the area
Home Values in the Area
Average Home Value in this Area
Purchase History
| Date | Buyer | Sale Price | Title Company |
|---|---|---|---|
| Thomas P & M C Kucia Ret | -- | None Available | |
| Thomas P & M C Kucia Ret | -- | None Available | |
| Kucia Thomas P | $487,000 | -- | |
| Newton James T | $229,000 | -- | |
| Kucia Thomas P | $487,000 | -- | |
| Newton James T | $229,000 | -- |
Source: Public Records
Mortgage History
| Date | Status | Borrower | Loan Amount |
|---|---|---|---|
| Previous Owner | Newton James T | $209,910 | |
| Previous Owner | Kucia Thomas P | $232,000 | |
| Previous Owner | Newton James T | $132,650 |
Source: Public Records
Tax History Compared to Growth
Tax History
| Year | Tax Paid | Tax Assessment Tax Assessment Total Assessment is a certain percentage of the fair market value that is determined by local assessors to be the total taxable value of land and additions on the property. | Land | Improvement |
|---|---|---|---|---|
| 2025 | $55 | $496,500 | $173,300 | $323,200 |
| 2024 | $5,950 | $523,800 | $207,900 | $315,900 |
| 2023 | $5,439 | $480,800 | $203,500 | $277,300 |
| 2022 | $5,439 | $429,300 | $186,600 | $242,700 |
| 2021 | $5,199 | $392,700 | $170,000 | $222,700 |
| 2020 | $5,257 | $400,700 | $178,000 | $222,700 |
| 2018 | $4,541 | $379,400 | $169,500 | $209,900 |
| 2017 | $4,439 | $353,400 | $169,500 | $183,900 |
| 2016 | $4,386 | $361,000 | $177,100 | $183,900 |
| 2015 | $4,343 | $352,800 | $168,900 | $183,900 |
| 2014 | $4,286 | $344,500 | $160,600 | $183,900 |
Source: Public Records
Map
Nearby Homes
- 1 Cedarbrook Unit A
- 383 Vinnicum Rd
- 3a Johnnies Way
- 3b Johnnies Way
- 3 Johnnies Way
- 7 Johnnies Way
- 129 Cameron Way
- 36 Columbine Rd
- 10 Quaker Ln
- 17 Sassafras Rd
- 107 & 107R Walker
- 24 Nod Rd
- 283 Plain St
- 0 Old Fall River Rd Unit 73399047
- 92 Martin St
- 75 Martin St
- 1261 Grand Army of the Republic Hwy
- 43 Baptist St
- 16 Martin St
- 127 Mason St
- 10 Bayberry St
- 206 Pleasant St
- 202 Pleasant St
- 7 Bayberry St
- 7 Davis St
- 3 Bayberry St
- 11 Davis St
- 11 Bayberry St
- 14 Bayberry St
- 1 Honeysuckle Rd
- 212 Pleasant St
- 205 Pleasant St
- 198 Pleasant St
- 0 Idlewoods Dr Unit 1069817
- 215 Pleasant St
- 4 Idlewoods Dr
- 4 Idlewoods Dr
- 4 Idlewoods Dr
- 235R Pleasant St
- Lot 17 Idlewoods Dr Unit Lot 17