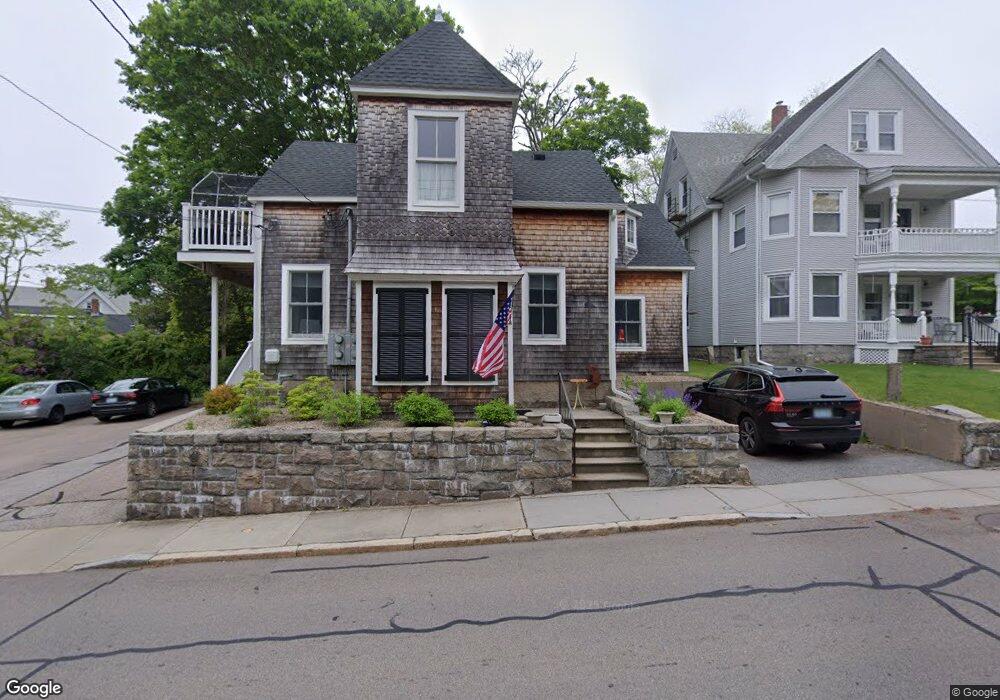
6 Beach St Westerly, RI 02891
Estimated Value: $579,231
1
Bed
4
Baths
460
Sq Ft
$1,259/Sq Ft
Est. Value
About This Home
This home is located at 6 Beach St, Westerly, RI 02891 and is currently estimated at $579,231, approximately $1,259 per square foot. 6 Beach St is a home located in Washington County with nearby schools including Westerly High School and St. Michael School.
Ownership History
Date
Name
Owned For
Owner Type
Purchase Details
Closed on
Oct 12, 2018
Sold by
Westerly Revolving Fun
Bought by
Mygatt Nancy F
Current Estimated Value
Home Financials for this Owner
Home Financials are based on the most recent Mortgage that was taken out on this home.
Original Mortgage
$255,000
Outstanding Balance
$221,917
Interest Rate
4.5%
Mortgage Type
Purchase Money Mortgage
Estimated Equity
$357,314
Purchase Details
Closed on
Feb 2, 2017
Sold by
B&B Real Estate Hldg L
Bought by
Westerly Revolving Fun
Home Financials for this Owner
Home Financials are based on the most recent Mortgage that was taken out on this home.
Original Mortgage
$195,000
Interest Rate
4.3%
Mortgage Type
Commercial
Purchase Details
Closed on
Dec 3, 2009
Sold by
Beach Plum Inn Dev Llc
Bought by
Niazyan Aleksandr and Smolnikova Nadezhda
Create a Home Valuation Report for This Property
The Home Valuation Report is an in-depth analysis detailing your home's value as well as a comparison with similar homes in the area
Home Values in the Area
Average Home Value in this Area
Purchase History
| Date | Buyer | Sale Price | Title Company |
|---|---|---|---|
| Mygatt Nancy F | $340,000 | -- | |
| Westerly Revolving Fun | $205,000 | -- | |
| Niazyan Aleksandr | $60,000 | -- |
Source: Public Records
Mortgage History
| Date | Status | Borrower | Loan Amount |
|---|---|---|---|
| Open | Mygatt Nancy F | $255,000 | |
| Previous Owner | Westerly Revolving Fun | $195,000 | |
| Previous Owner | Niazyan Aleksandr | $40,000 |
Source: Public Records
Property History
| Date | Event | Price | List to Sale | Price per Sq Ft |
|---|---|---|---|---|
| 10/01/2024 10/01/24 | For Rent | $1,400 | -- | -- |
Tax History
| Year | Tax Paid | Tax Assessment Tax Assessment Total Assessment is a certain percentage of the fair market value that is determined by local assessors to be the total taxable value of land and additions on the property. | Land | Improvement |
|---|---|---|---|---|
| 2025 | $3,650 | $469,200 | $144,200 | $325,000 |
| 2024 | $3,215 | $307,700 | $103,000 | $204,700 |
| 2023 | $3,126 | $307,700 | $103,000 | $204,700 |
| 2022 | $3,108 | $307,700 | $103,000 | $204,700 |
| 2021 | $3,509 | $291,000 | $89,600 | $201,400 |
| 2020 | $3,448 | $291,000 | $89,600 | $201,400 |
| 2019 | $3,313 | $282,200 | $89,600 | $192,600 |
| 2018 | $3,253 | $263,400 | $89,600 | $173,800 |
| 2017 | $2,666 | $222,200 | $89,600 | $132,600 |
| 2016 | $2,666 | $222,200 | $89,600 | $132,600 |
| 2015 | $2,657 | $236,600 | $91,400 | $145,200 |
| 2014 | $2,614 | $236,600 | $91,400 | $145,200 |
Source: Public Records
Map
Nearby Homes
- 38 Prospect St Unit B
- 25 School St Unit 2
- 16 Spring St
- 14 George St
- 15 Moss St
- 13 Moss St
- 141 W Broad St
- 21 North Dr
- 19 Crestview Dr Unit C
- 23 Abbey Ln Unit 12
- 19 Lathrop Ave
- 24 Abbey Ln Unit 13
- 7 Dixon St
- 51 Pequot Trail
- 52 Bellevue Ave
- 55 Pleasant St
- 93 S Broad St
- 33 Whipple Ave
- 22 Colonial Dr
- 12 Batterson Ave
Your Personal Tour Guide
Ask me questions while you tour the home.