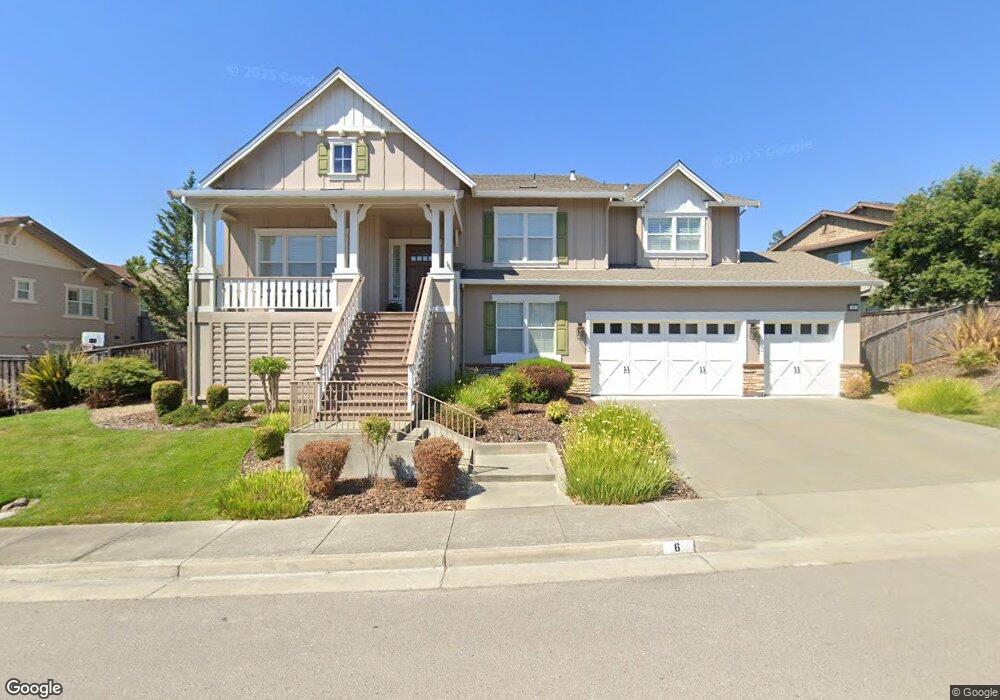
6 Bixby Ct Petaluma, CA 94952
Western Petaluma NeighborhoodEstimated Value: $1,844,194 - $2,211,000
3
Beds
4
Baths
3,917
Sq Ft
$518/Sq Ft
Est. Value
About This Home
This home is located at 6 Bixby Ct, Petaluma, CA 94952 and is currently estimated at $2,027,049, approximately $517 per square foot. 6 Bixby Ct is a home located in Sonoma County with nearby schools including Wilson Elementary School, Petaluma Junior High School, and Petaluma High School.
Ownership History
Date
Name
Owned For
Owner Type
Purchase Details
Closed on
Aug 2, 2012
Sold by
Beels James M and Beels Donna J
Bought by
Beels James M and Beels Donna J
Current Estimated Value
Purchase Details
Closed on
Aug 9, 2007
Sold by
Rockridge Pointe Investors Llc
Bought by
Beels James M and Beels Donna J
Home Financials for this Owner
Home Financials are based on the most recent Mortgage that was taken out on this home.
Original Mortgage
$937,522
Outstanding Balance
$592,377
Interest Rate
6.62%
Mortgage Type
Purchase Money Mortgage
Estimated Equity
$1,434,672
Create a Home Valuation Report for This Property
The Home Valuation Report is an in-depth analysis detailing your home's value as well as a comparison with similar homes in the area
Home Values in the Area
Average Home Value in this Area
Purchase History
| Date | Buyer | Sale Price | Title Company |
|---|---|---|---|
| Beels James M | -- | None Available | |
| Beels James M | $1,172,000 | First American Title Company |
Source: Public Records
Mortgage History
| Date | Status | Borrower | Loan Amount |
|---|---|---|---|
| Open | Beels James M | $937,522 |
Source: Public Records
Tax History Compared to Growth
Tax History
| Year | Tax Paid | Tax Assessment Tax Assessment Total Assessment is a certain percentage of the fair market value that is determined by local assessors to be the total taxable value of land and additions on the property. | Land | Improvement |
|---|---|---|---|---|
| 2025 | $16,242 | $1,532,734 | $656,753 | $875,981 |
| 2024 | $16,242 | $1,502,681 | $643,876 | $858,805 |
| 2023 | $16,242 | $1,473,217 | $631,251 | $841,966 |
| 2022 | $15,894 | $1,444,331 | $618,874 | $825,457 |
| 2021 | $15,534 | $1,416,012 | $606,740 | $809,272 |
| 2020 | $15,655 | $1,401,493 | $600,519 | $800,974 |
| 2019 | $15,404 | $1,374,014 | $588,745 | $785,269 |
| 2018 | $15,318 | $1,347,073 | $577,201 | $769,872 |
| 2017 | $15,059 | $1,320,661 | $565,884 | $754,777 |
| 2016 | $14,153 | $1,255,000 | $538,000 | $717,000 |
| 2015 | $12,244 | $1,095,000 | $469,000 | $626,000 |
| 2014 | $12,220 | $1,085,000 | $465,000 | $620,000 |
Source: Public Records
Map
Nearby Homes