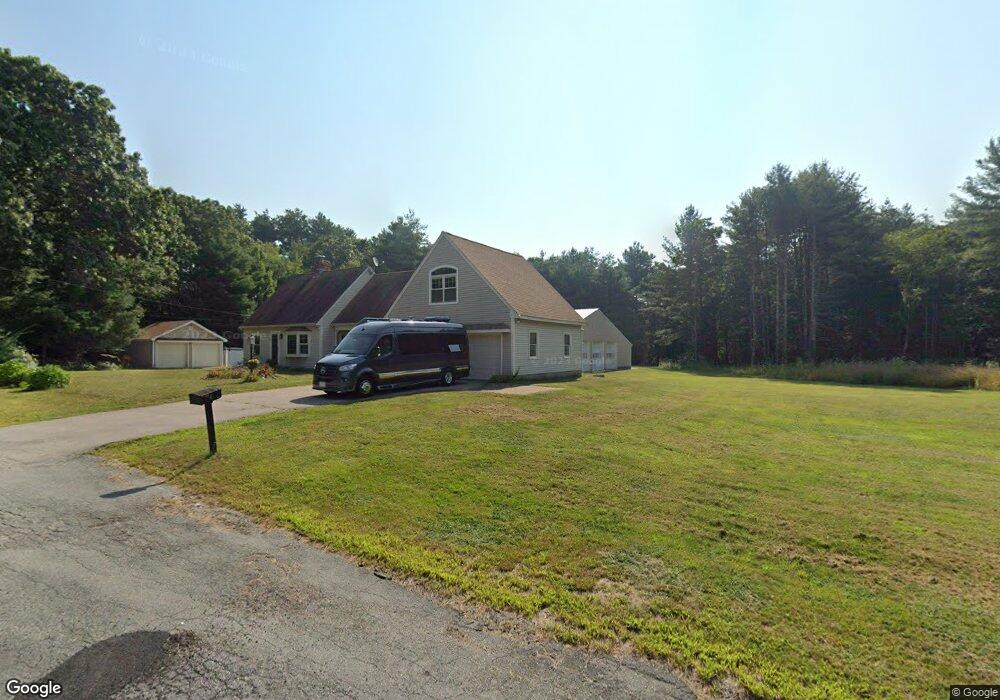
6 Blackstone St Bellingham, MA 02019
Estimated Value: $621,000 - $725,000
3
Beds
2
Baths
1,624
Sq Ft
$411/Sq Ft
Est. Value
About This Home
This home is located at 6 Blackstone St, Bellingham, MA 02019 and is currently estimated at $666,764, approximately $410 per square foot. 6 Blackstone St is a home located in Norfolk County with nearby schools including Stall Brook Elementary School, Bellingham High School, and Bethany Christian Academy.
Ownership History
Date
Name
Owned For
Owner Type
Purchase Details
Closed on
Jun 22, 2012
Sold by
Moore Edward T and Moore Judith A
Bought by
E & J Rt
Current Estimated Value
Purchase Details
Closed on
Nov 21, 2000
Sold by
Remy Lucille G
Bought by
Allen Co Inc
Create a Home Valuation Report for This Property
The Home Valuation Report is an in-depth analysis detailing your home's value as well as a comparison with similar homes in the area
Home Values in the Area
Average Home Value in this Area
Purchase History
| Date | Buyer | Sale Price | Title Company |
|---|---|---|---|
| E & J Rt | -- | -- | |
| Allen Co Inc | $300,000 | -- |
Source: Public Records
Mortgage History
| Date | Status | Borrower | Loan Amount |
|---|---|---|---|
| Previous Owner | Allen Co Inc | $175,000 | |
| Previous Owner | Allen Co Inc | $12,751 |
Source: Public Records
Tax History Compared to Growth
Tax History
| Year | Tax Paid | Tax Assessment Tax Assessment Total Assessment is a certain percentage of the fair market value that is determined by local assessors to be the total taxable value of land and additions on the property. | Land | Improvement |
|---|---|---|---|---|
| 2025 | $7,653 | $609,300 | $175,200 | $434,100 |
| 2024 | $7,382 | $574,000 | $160,000 | $414,000 |
| 2023 | $7,119 | $545,500 | $152,300 | $393,200 |
| 2022 | $6,184 | $439,200 | $132,700 | $306,500 |
| 2021 | $5,528 | $383,600 | $132,700 | $250,900 |
| 2020 | $5,217 | $366,900 | $132,700 | $234,200 |
| 2019 | $5,100 | $358,900 | $132,700 | $226,200 |
| 2018 | $4,868 | $337,800 | $133,600 | $204,200 |
| 2017 | $4,768 | $332,500 | $133,600 | $198,900 |
| 2016 | $4,653 | $325,600 | $138,900 | $186,700 |
| 2015 | $4,487 | $314,900 | $133,600 | $181,300 |
| 2014 | $4,528 | $308,900 | $130,100 | $178,800 |
Source: Public Records
Map
Nearby Homes
- 501 Old Bridge Ln Unit 501
- 1501 Old Bridge Ln Unit 1501
- 1303 Old Bridge Ln Unit 1303
- 7 Debra Ln
- 1136 S Main St
- 1099 S Main St
- 125 Blackstone St
- 11 Silver Ave
- 89 Lakeview Ave
- 19 Geordan Ave
- 46 Douglas Dr
- 975 S Main St
- 123-125 Mendon St
- 108 N Main St
- 49 Horseshoe Dr
- 1 Clover Dr
- 0 Prospect St
- 151 Stone Ridge Rd
- 26 Iris Ln
- 33 Stone Ridge Rd Unit 33
- 147 Mechanic St
- 144 Mechanic St
- 139 Mechanic St
- 1 Patrick St
- 3703 Maple Brook Rd Unit 37C
- 3702 Maple Brook Rd Unit 37B
- 3701 Maple Brook Rd Unit 37A
- 3703 Maple Brook Rd
- 3702 Maple Brook Rd
- 3701 Maple Brook Rd
- 3702 Maple Brook Rd Unit 3702
- 161 Mechanic St
- 3603 Maple Brook Rd Unit 36C
- 3601 Maple Brook Rd Unit 36A
- 3603 Maple Brook Rd
- 3601 Maple Brook Rd
- 3603 Maple Brook Rd Unit 3603
- 3601 Maple Brook Rd Unit 3601
- 3602 Maple Brook Rd Unit 36B
- 3602 Maple Brook Rd