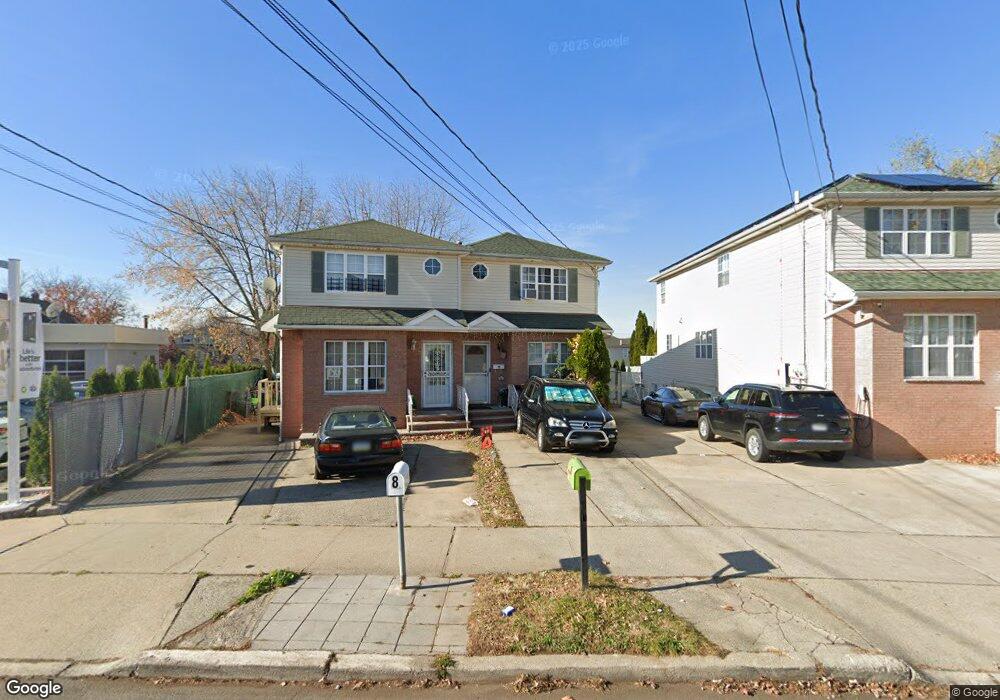
6 Bradley Ave Unit 10 Staten Island, NY 10314
Westerleigh NeighborhoodEstimated Value: $771,932 - $1,018,000
4
Beds
4
Baths
2,000
Sq Ft
$442/Sq Ft
Est. Value
About This Home
This home is located at 6 Bradley Ave Unit 10, Staten Island, NY 10314 and is currently estimated at $884,733, approximately $442 per square foot. 6 Bradley Ave Unit 10 is a home located in Richmond County with nearby schools including P.S. 30 Westerleigh, I.S. 51 Edwin Markham, and Port Richmond High School.
Ownership History
Date
Name
Owned For
Owner Type
Purchase Details
Closed on
Sep 8, 2020
Sold by
Eng Harrison Weixing and Bao Limei
Bought by
Eng Harrion Weixing
Current Estimated Value
Purchase Details
Closed on
Aug 24, 1999
Sold by
Russo Frank
Bought by
Eng Harrison Weixing and Bao Limei
Home Financials for this Owner
Home Financials are based on the most recent Mortgage that was taken out on this home.
Original Mortgage
$100,000
Interest Rate
7.9%
Create a Home Valuation Report for This Property
The Home Valuation Report is an in-depth analysis detailing your home's value as well as a comparison with similar homes in the area
Home Values in the Area
Average Home Value in this Area
Purchase History
| Date | Buyer | Sale Price | Title Company |
|---|---|---|---|
| Eng Harrion Weixing | -- | Fidelity National Ttl Ins Co | |
| Eng Harrison Weixing | $241,500 | -- |
Source: Public Records
Mortgage History
| Date | Status | Borrower | Loan Amount |
|---|---|---|---|
| Previous Owner | Eng Harrison Weixing | $100,000 |
Source: Public Records
Tax History Compared to Growth
Tax History
| Year | Tax Paid | Tax Assessment Tax Assessment Total Assessment is a certain percentage of the fair market value that is determined by local assessors to be the total taxable value of land and additions on the property. | Land | Improvement |
|---|---|---|---|---|
| 2025 | $7,323 | $55,740 | $9,498 | $46,242 |
| 2024 | $7,323 | $48,360 | $10,947 | $37,413 |
| 2023 | $6,938 | $34,543 | $9,686 | $24,857 |
| 2022 | $6,506 | $43,800 | $14,520 | $29,280 |
| 2021 | $6,470 | $40,740 | $14,520 | $26,220 |
| 2020 | $8,058 | $42,720 | $14,520 | $28,200 |
| 2019 | $6,356 | $37,140 | $14,520 | $22,620 |
| 2018 | $5,868 | $28,786 | $11,787 | $16,999 |
| 2017 | $5,536 | $27,157 | $14,256 | $12,901 |
| 2016 | $5,122 | $25,620 | $14,520 | $11,100 |
| 2015 | $4,859 | $25,320 | $16,140 | $9,180 |
| 2014 | $4,859 | $25,320 | $16,140 | $9,180 |
Source: Public Records
Map
Nearby Homes