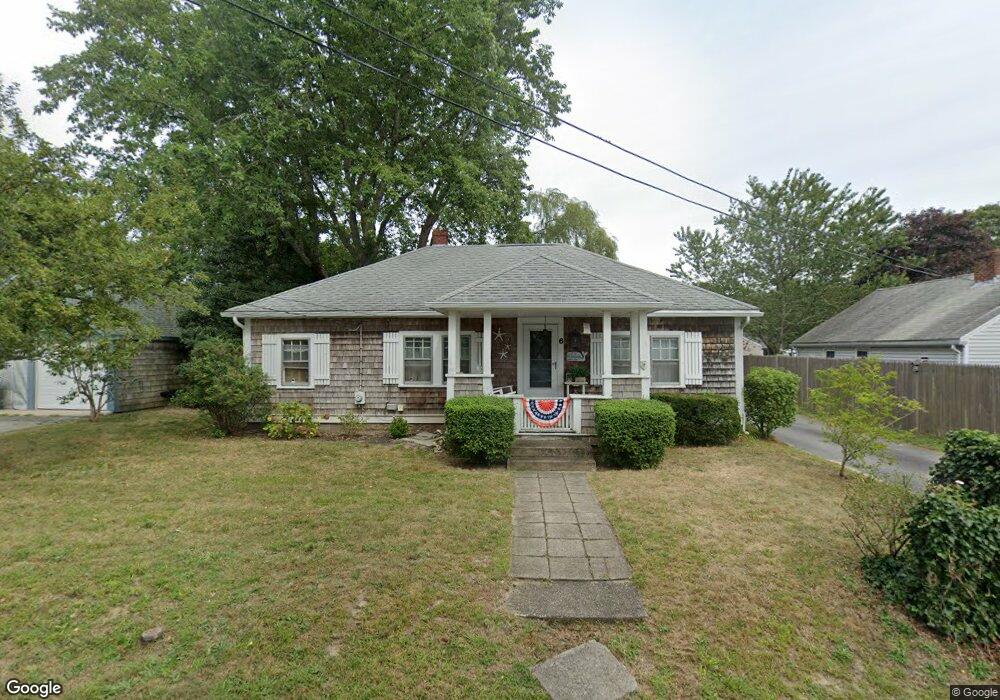
6 Bryar Ln South Yarmouth, MA 02664
Estimated Value: $459,000 - $542,000
3
Beds
1
Bath
1,001
Sq Ft
$516/Sq Ft
Est. Value
About This Home
This home is located at 6 Bryar Ln, South Yarmouth, MA 02664 and is currently estimated at $516,272, approximately $515 per square foot. 6 Bryar Ln is a home located in Barnstable County with nearby schools including Dennis-Yarmouth Regional High School and St. Pius X. School.
Ownership History
Date
Name
Owned For
Owner Type
Purchase Details
Closed on
Jun 25, 1997
Sold by
Vermette John L and Vermette Heatherlee
Bought by
Coffey Patricia A
Current Estimated Value
Home Financials for this Owner
Home Financials are based on the most recent Mortgage that was taken out on this home.
Original Mortgage
$81,800
Interest Rate
7.81%
Mortgage Type
Purchase Money Mortgage
Create a Home Valuation Report for This Property
The Home Valuation Report is an in-depth analysis detailing your home's value as well as a comparison with similar homes in the area
Home Values in the Area
Average Home Value in this Area
Purchase History
| Date | Buyer | Sale Price | Title Company |
|---|---|---|---|
| Coffey Patricia A | $91,000 | -- |
Source: Public Records
Mortgage History
| Date | Status | Borrower | Loan Amount |
|---|---|---|---|
| Open | Coffey Patricia A | $100,000 | |
| Closed | Coffey Patricia A | $81,800 |
Source: Public Records
Tax History Compared to Growth
Tax History
| Year | Tax Paid | Tax Assessment Tax Assessment Total Assessment is a certain percentage of the fair market value that is determined by local assessors to be the total taxable value of land and additions on the property. | Land | Improvement |
|---|---|---|---|---|
| 2025 | $3,110 | $439,200 | $157,600 | $281,600 |
| 2024 | $2,896 | $392,400 | $133,200 | $259,200 |
| 2023 | $2,883 | $355,500 | $115,400 | $240,100 |
| 2022 | $2,728 | $297,200 | $104,900 | $192,300 |
| 2021 | $2,569 | $268,700 | $104,900 | $163,800 |
| 2020 | $2,516 | $251,600 | $104,900 | $146,700 |
| 2019 | $2,334 | $231,100 | $104,900 | $126,200 |
| 2018 | $2,217 | $215,500 | $89,300 | $126,200 |
| 2017 | $2,121 | $211,700 | $85,500 | $126,200 |
| 2016 | $2,035 | $203,900 | $77,700 | $126,200 |
| 2015 | $1,996 | $198,800 | $77,700 | $121,100 |
Source: Public Records
Map
Nearby Homes