
Seller's Agent in 2025
Deborah Evans
J. Barrett & Company
(978) 314-5970
39 in this area
115 Total Sales
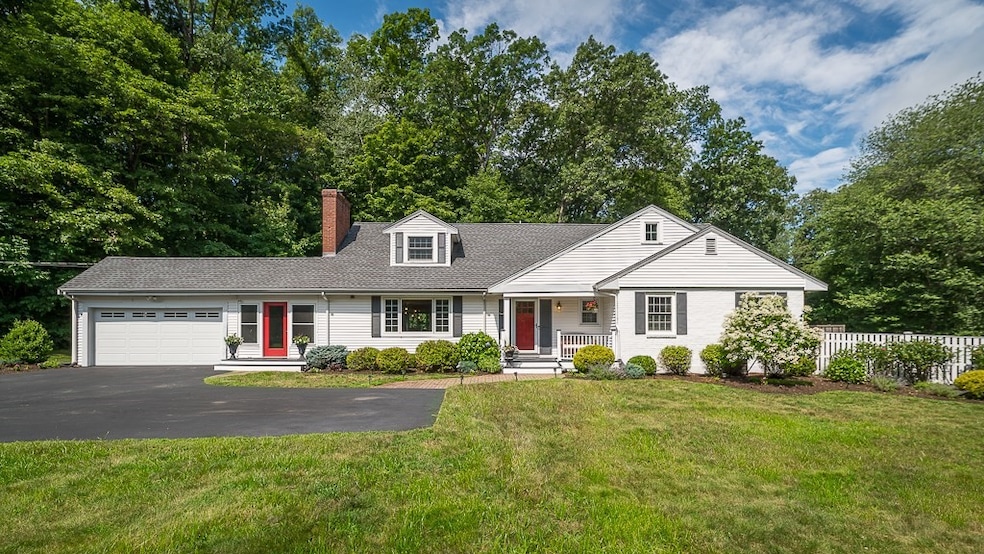
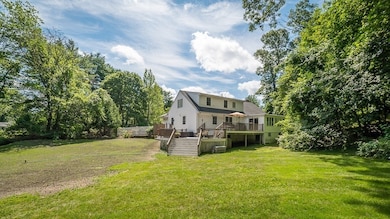
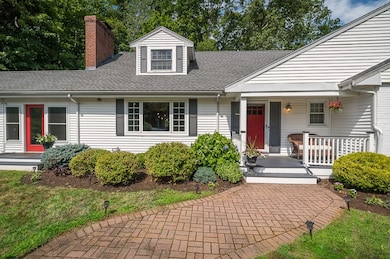
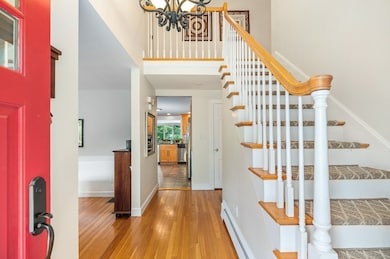
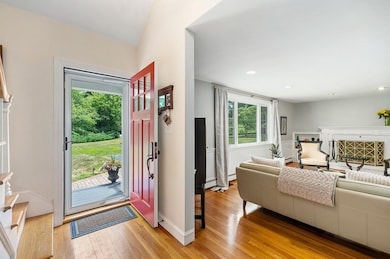
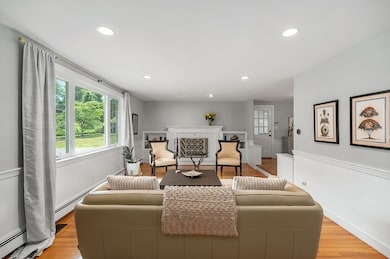
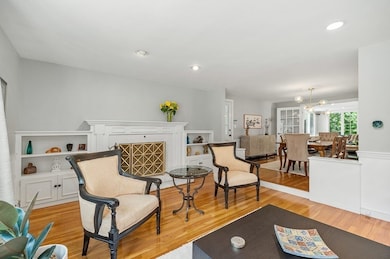
Tucked behind mature landscaping on a private 1.49-acre lot, this sunny and beautifully maintained 5-bedroom, 3-bath Cape is a hidden gem in Wenham’s desirable Lord’s Hill neighborhood. Enjoy an open floor plan, gleaming hardwood floors and expansive windows throughout. At the heart of the home is a custom kitchen featuring granite counters, stainless appliances, breakfast bar and dining area with sliders to a multilevel deck. The kitchen opens seamlessly into the family room, dining room, and living room with fireplace and custom built-ins. The main level offers 3 bedrooms, including one with an en-suite bath, plus an additional full bathroom. Upstairs, discover 2 more bedrooms including the primary suite with a walk-in closet and en-suite bath. Enjoy the professionally landscaped yard from your expansive deck. Two-car garage, central air. Located in an established neighborhood with top-rated schools and easy access to highways and the commuter rail. Must see!
| Date | Type | Sale Price | Title Company |
|---|---|---|---|
| Quit Claim Deed | $1,275,000 | -- | |
| Deed | $1,275,000 | -- | |
| Deed | $550,000 | -- | |
| Deed | $550,000 | -- | |
| Deed | $359,000 | -- | |
| Deed | $359,000 | -- | |
| Deed | $323,500 | -- | |
| Deed | $323,500 | -- |
| Date | Status | Loan Amount | Loan Type |
|---|---|---|---|
| Open | $1,000,000 | New Conventional | |
| Closed | $1,000,000 | New Conventional | |
| Previous Owner | $598,500 | No Value Available |
| Date | Event | Price | List to Sale | Price per Sq Ft |
|---|---|---|---|---|
| 09/08/2025 09/08/25 | Sold | $1,275,000 | +2.0% | $419 / Sq Ft |
| 07/14/2025 07/14/25 | Pending | -- | -- | -- |
| 07/09/2025 07/09/25 | For Sale | $1,250,000 | -- | $411 / Sq Ft |
| Year | Tax Paid | Tax Assessment Tax Assessment Total Assessment is a certain percentage of the fair market value that is determined by local assessors to be the total taxable value of land and additions on the property. | Land | Improvement |
|---|---|---|---|---|
| 2025 | $14,351 | $923,500 | $506,200 | $417,300 |
| 2024 | $14,114 | $901,300 | $506,200 | $395,100 |
| 2023 | $14,584 | $840,600 | $550,800 | $289,800 |
| 2022 | $13,780 | $703,800 | $427,100 | $276,700 |
| 2021 | $13,239 | $672,700 | $396,000 | $276,700 |
| 2020 | $12,678 | $669,400 | $396,100 | $273,300 |
| 2019 | $12,063 | $669,400 | $396,100 | $273,300 |
| 2018 | $11,257 | $599,100 | $383,600 | $215,500 |
| 2017 | $10,982 | $599,100 | $383,600 | $215,500 |
| 2016 | $10,173 | $599,100 | $383,600 | $215,500 |
| 2015 | $9,735 | $599,100 | $383,600 | $215,500 |
Seller's Agent in 2025
Deborah Evans
J. Barrett & Company
(978) 314-5970
39 in this area
115 Total Sales
E
Seller Co-Listing Agent in 2025
Elaine Horrocks
J. Barrett & Company
10 in this area
23 Total Sales
M
Buyer's Agent in 2025
Mark Wade
Coldwell Banker Realty - Marblehead
(781) 864-9812
1 in this area
29 Total Sales
Source: MLS Property Information Network (MLS PIN)
MLS Number: 73402022
APN: WENH-000035-000000-000028
Disclaimer: Certain information contained herein is derived from information provided by parties other than Homes.com. All information provided is deemed reliable, but is not guaranteed to be accurate and should be independently verified.
![]() The property listing data and information, or the Images, set forth herein were provided to MLS Property Information Network, Inc. from third party sources, including sellers, lessors and public records, and were compiled by MLS Property Information Network, Inc. The property listing data and information, and the Images, are for the personal, non-commercial use of consumers having a good faith interest in purchasing or leasing listed properties of the type displayed to them and may not be used for any purpose other than to identify prospective properties which such consumers may have a good faith interest in purchasing or leasing. MLS Property Information Network, Inc. and its subscribers disclaim any and all representations and warranties as to the accuracy of the property listing data and information, or as to the accuracy of any of the Images, set forth herein.
The property listing data and information, or the Images, set forth herein were provided to MLS Property Information Network, Inc. from third party sources, including sellers, lessors and public records, and were compiled by MLS Property Information Network, Inc. The property listing data and information, and the Images, are for the personal, non-commercial use of consumers having a good faith interest in purchasing or leasing listed properties of the type displayed to them and may not be used for any purpose other than to identify prospective properties which such consumers may have a good faith interest in purchasing or leasing. MLS Property Information Network, Inc. and its subscribers disclaim any and all representations and warranties as to the accuracy of the property listing data and information, or as to the accuracy of any of the Images, set forth herein.
Ask me questions while you tour the home.