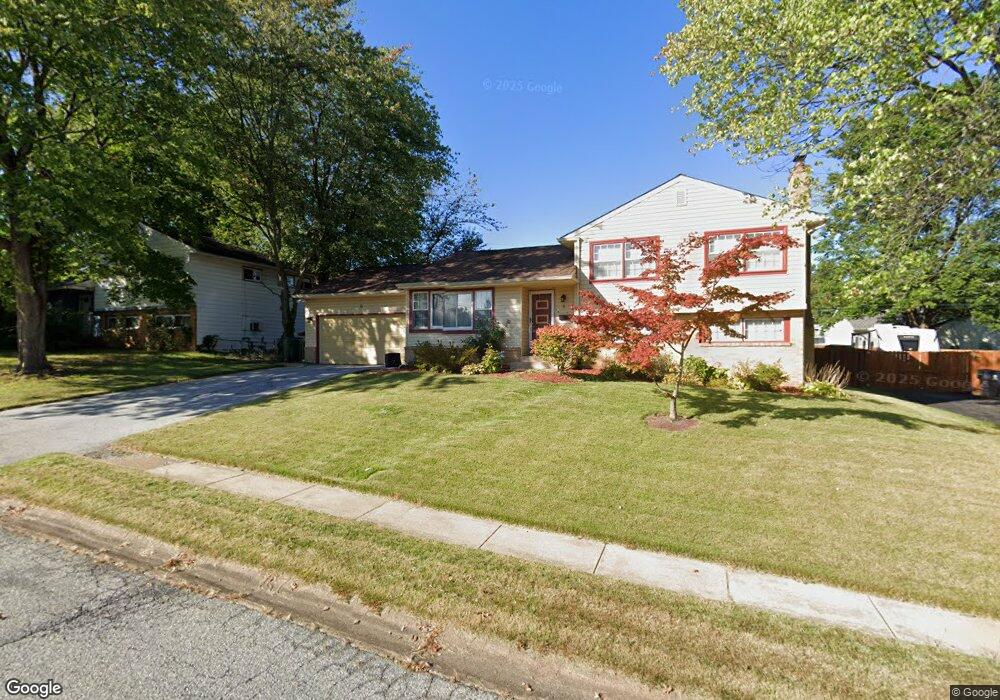
6 Burns Rd Claymont, DE 19703
Estimated Value: $399,000 - $409,000
4
Beds
2
Baths
1,416
Sq Ft
$284/Sq Ft
Est. Value
About This Home
This home is located at 6 Burns Rd, Claymont, DE 19703 and is currently estimated at $402,278, approximately $284 per square foot. 6 Burns Rd is a home located in New Castle County with nearby schools including Claymont Elementary School, Talley Middle School, and Mount Pleasant High School.
Ownership History
Date
Name
Owned For
Owner Type
Purchase Details
Closed on
Feb 9, 2018
Sold by
Cameron Robert L
Bought by
Cameron Karen R
Current Estimated Value
Home Financials for this Owner
Home Financials are based on the most recent Mortgage that was taken out on this home.
Original Mortgage
$223,100
Outstanding Balance
$185,663
Interest Rate
3.95%
Mortgage Type
New Conventional
Estimated Equity
$216,615
Purchase Details
Closed on
Jul 14, 2006
Sold by
Hazewski Judith C and Hazewski June A
Bought by
Cameron Robert L
Home Financials for this Owner
Home Financials are based on the most recent Mortgage that was taken out on this home.
Original Mortgage
$260,000
Interest Rate
6.67%
Mortgage Type
VA
Purchase Details
Closed on
Feb 14, 2005
Sold by
Hazewski Judith C
Bought by
Hazewski Judith C and Hazewski June A
Create a Home Valuation Report for This Property
The Home Valuation Report is an in-depth analysis detailing your home's value as well as a comparison with similar homes in the area
Home Values in the Area
Average Home Value in this Area
Purchase History
We collect this data history from publicly available records. To have your information removed, we recommend requesting removal directly through your county’s website.
| Date | Buyer | Sale Price | Title Company |
|---|---|---|---|
| Cameron Karen R | -- | None Available | |
| Cameron Robert L | $260,000 | None Available | |
| Hazewski Judith C | -- | -- |
Source: Public Records
Mortgage History
We collect this data history from publicly available records. To have your information removed, we recommend requesting removal directly through your county’s website.
| Date | Status | Borrower | Loan Amount |
|---|---|---|---|
| Open | Cameron Karen R | $223,100 | |
| Closed | Cameron Robert L | $260,000 |
Source: Public Records
Tax History
| Year | Tax Paid | Tax Assessment Tax Assessment Total Assessment is a certain percentage of the fair market value that is determined by local assessors to be the total taxable value of land and additions on the property. | Land | Improvement |
|---|---|---|---|---|
| 2025 | $2,490 | $393,100 | $70,000 | $323,100 |
| 2024 | $2,280 | $59,900 | $11,600 | $48,300 |
| 2023 | $2,083 | $59,900 | $11,600 | $48,300 |
| 2022 | $2,119 | $59,900 | $11,600 | $48,300 |
| 2021 | $2,119 | $59,900 | $11,600 | $48,300 |
| 2020 | $2,119 | $59,900 | $11,600 | $48,300 |
| 2019 | $2,245 | $59,900 | $11,600 | $48,300 |
| 2018 | $2,025 | $59,900 | $11,600 | $48,300 |
| 2017 | $1,994 | $59,900 | $11,600 | $48,300 |
| 2016 | $1,993 | $59,900 | $11,600 | $48,300 |
| 2015 | $1,833 | $59,900 | $11,600 | $48,300 |
| 2014 | $1,832 | $59,900 | $11,600 | $48,300 |
Source: Public Records
Map
Nearby Homes
Your Personal Tour Guide
Ask me questions while you tour the home.