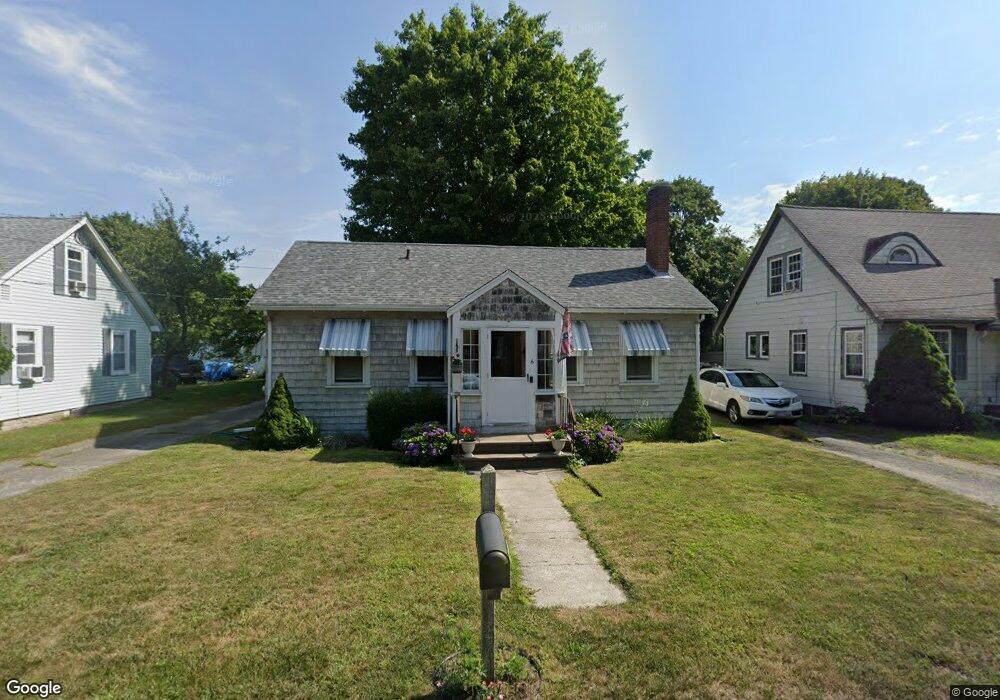
6 Burr Pkwy Wareham, MA 02571
Wareham Center NeighborhoodEstimated Value: $397,455 - $415,000
2
Beds
1
Bath
800
Sq Ft
$507/Sq Ft
Est. Value
About This Home
This home is located at 6 Burr Pkwy, Wareham, MA 02571 and is currently estimated at $405,614, approximately $507 per square foot. 6 Burr Pkwy is a home located in Plymouth County with nearby schools including Tabor Academy.
Ownership History
Date
Name
Owned For
Owner Type
Purchase Details
Closed on
Dec 10, 2001
Sold by
Gladys T Macmillan Est
Bought by
Kelsch John F and Young Lauren J
Current Estimated Value
Home Financials for this Owner
Home Financials are based on the most recent Mortgage that was taken out on this home.
Original Mortgage
$124,000
Interest Rate
6.67%
Mortgage Type
Purchase Money Mortgage
Create a Home Valuation Report for This Property
The Home Valuation Report is an in-depth analysis detailing your home's value as well as a comparison with similar homes in the area
Home Values in the Area
Average Home Value in this Area
Purchase History
| Date | Buyer | Sale Price | Title Company |
|---|---|---|---|
| Kelsch John F | $155,000 | -- | |
| Kelsch John F | $155,000 | -- |
Source: Public Records
Mortgage History
| Date | Status | Borrower | Loan Amount |
|---|---|---|---|
| Open | Kelsch John F | $127,600 | |
| Closed | Kelsch John F | $124,000 |
Source: Public Records
Tax History Compared to Growth
Tax History
| Year | Tax Paid | Tax Assessment Tax Assessment Total Assessment is a certain percentage of the fair market value that is determined by local assessors to be the total taxable value of land and additions on the property. | Land | Improvement |
|---|---|---|---|---|
| 2025 | $3,345 | $321,000 | $110,500 | $210,500 |
| 2024 | $3,262 | $290,500 | $86,500 | $204,000 |
| 2023 | $2,975 | $260,800 | $78,600 | $182,200 |
| 2022 | $2,975 | $225,700 | $78,600 | $147,100 |
| 2021 | $2,948 | $219,200 | $78,600 | $140,600 |
| 2020 | $2,762 | $208,300 | $78,600 | $129,700 |
| 2019 | $2,734 | $205,700 | $76,400 | $129,300 |
| 2018 | $2,590 | $190,000 | $76,400 | $113,600 |
| 2017 | $2,406 | $178,900 | $76,400 | $102,500 |
| 2016 | $2,215 | $163,700 | $74,700 | $89,000 |
| 2015 | $2,140 | $163,700 | $74,700 | $89,000 |
| 2014 | $2,138 | $166,400 | $70,900 | $95,500 |
Source: Public Records
Map
Nearby Homes
- 233 Marion Rd
- 6 A Rock Marsh Rd Unit A
- 6 A Rock Marsh Rd Unit A
- 21 Windsor Dr
- 67 Swifts Beach Rd
- 437 Main St
- 53 Starboard Dr Unit 36G
- 5 Sola's Cir
- 62 High St
- 4 Bachant Way
- 0 Main St Unit 73450471
- 110 Mayflower Ridge Dr
- 687 Main St
- 15 Broadmarsh Ave
- 21 Weston Ave
- 6 Allen Ave
- 45 Main St Unit 38
- 8 Weston Ave
- 20 Grant St
- 8 Charles St