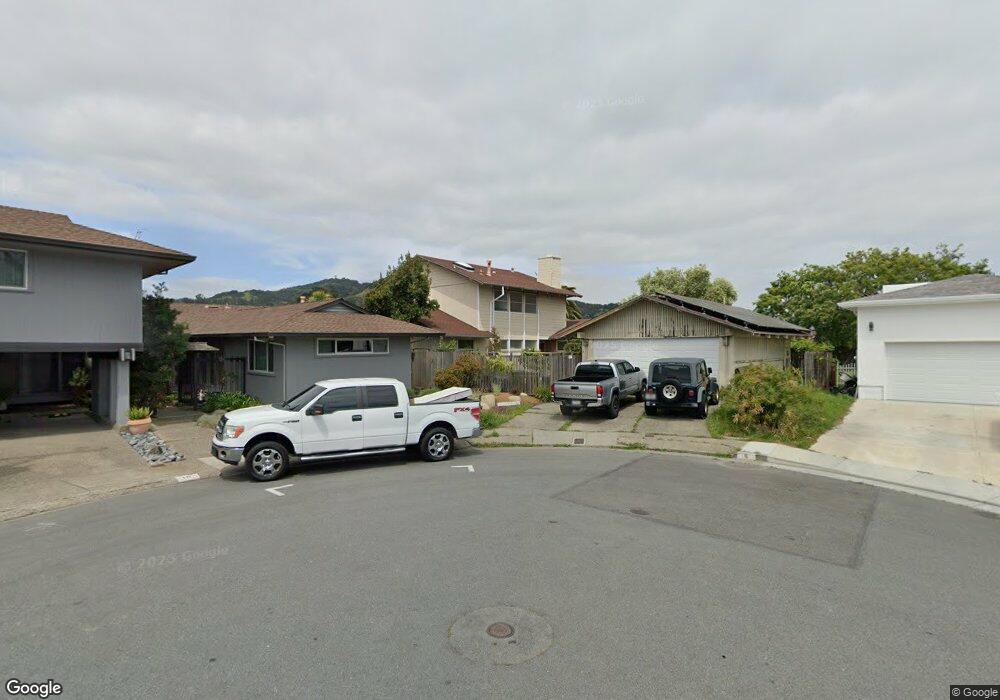
6 Capri Ct San Rafael, CA 94901
Canal NeighborhoodEstimated Value: $1,489,000 - $1,704,000
4
Beds
3
Baths
2,610
Sq Ft
$602/Sq Ft
Est. Value
About This Home
This home is located at 6 Capri Ct, San Rafael, CA 94901 and is currently estimated at $1,571,983, approximately $602 per square foot. 6 Capri Ct is a home with nearby schools including Bahia Vista Elementary School, James B. Davidson Middle School, and San Rafael High School.
Ownership History
Date
Name
Owned For
Owner Type
Purchase Details
Closed on
Feb 8, 2025
Sold by
Tore Abrahamsen Living Trust and Abrahamsen Espen Smestad
Bought by
Abrahamsen Espen Smestad
Current Estimated Value
Purchase Details
Closed on
Feb 5, 2024
Sold by
Abrahamsen Tore
Bought by
Tore Abrahamsen Living Trust and Abrahamsen
Purchase Details
Closed on
Sep 27, 2000
Sold by
Olson Carl E and Linda Olson
Bought by
Abrahamsen Tore
Home Financials for this Owner
Home Financials are based on the most recent Mortgage that was taken out on this home.
Original Mortgage
$252,000
Interest Rate
7.98%
Purchase Details
Closed on
Jul 24, 1996
Sold by
Olson Carl Edward
Bought by
Olson Carl Edward and Olson Linda L
Purchase Details
Closed on
Feb 15, 1996
Sold by
Olson Carl Edward
Bought by
Olson Carl Edward
Create a Home Valuation Report for This Property
The Home Valuation Report is an in-depth analysis detailing your home's value as well as a comparison with similar homes in the area
Home Values in the Area
Average Home Value in this Area
Purchase History
| Date | Buyer | Sale Price | Title Company |
|---|---|---|---|
| Abrahamsen Espen Smestad | -- | None Listed On Document | |
| Tore Abrahamsen Living Trust | -- | None Listed On Document | |
| Abrahamsen Tore | $570,000 | Old Republic Title Company | |
| Olson Carl Edward | -- | -- | |
| Olson Carl Edward | -- | -- |
Source: Public Records
Mortgage History
| Date | Status | Borrower | Loan Amount |
|---|---|---|---|
| Previous Owner | Abrahamsen Tore | $252,000 |
Source: Public Records
Tax History Compared to Growth
Tax History
| Year | Tax Paid | Tax Assessment Tax Assessment Total Assessment is a certain percentage of the fair market value that is determined by local assessors to be the total taxable value of land and additions on the property. | Land | Improvement |
|---|---|---|---|---|
| 2025 | $11,636 | $858,307 | $385,722 | $472,585 |
| 2024 | $11,636 | $841,480 | $378,160 | $463,320 |
| 2023 | $11,428 | $824,983 | $370,746 | $454,237 |
| 2022 | $10,801 | $808,811 | $363,479 | $445,332 |
| 2021 | $10,634 | $792,952 | $356,352 | $436,600 |
| 2020 | $10,588 | $784,823 | $352,698 | $432,125 |
| 2019 | $10,132 | $769,437 | $345,784 | $423,653 |
| 2018 | $10,047 | $754,352 | $339,005 | $415,347 |
| 2017 | $9,673 | $739,564 | $332,359 | $407,205 |
| 2016 | $9,353 | $725,067 | $325,844 | $399,223 |
| 2015 | $8,940 | $714,181 | $320,952 | $393,229 |
| 2014 | $8,571 | $700,196 | $314,667 | $385,529 |
Source: Public Records
Map
Nearby Homes
- 199 Canal St Unit 6
- 120 Canal St
- 20 Porto Bello Dr
- 9 Porto Bello Dr
- 29 Porto Bello Dr
- 48 Porto Bello Dr
- 22 Fairfax St Unit B
- 3665 Kerner Blvd Unit D
- 3665 Kerner Blvd Unit B
- 18 Fairfax St Unit D
- 35 Fairfax St Unit 8
- 21 Marina Blvd
- 102 Marina Court Dr
- 56 Mooring Rd Unit 2
- 231 Playa Del Rey
- 4 Point San Pedro Rd Unit 4
- 490 Canal St Unit 6
- 139 Nantucket Cove
- 13 Hingham Cove
- 80 Baypoint Dr