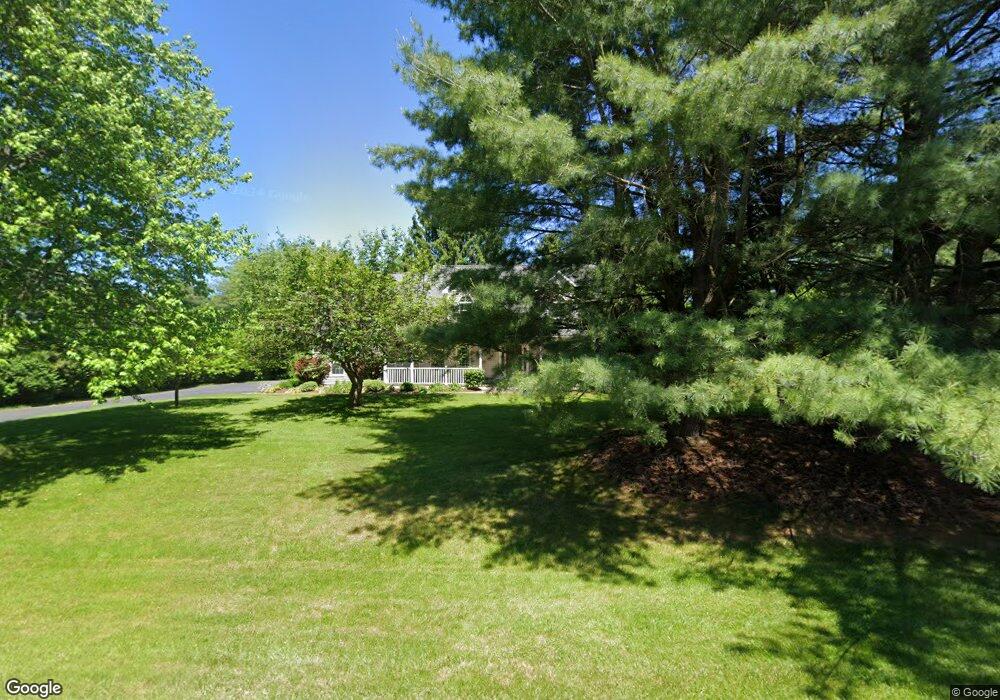
6 Chelseas Walk Ithaca, NY 14850
Lansing NeighborhoodEstimated Value: $647,933 - $710,000
4
Beds
3
Baths
2,589
Sq Ft
$265/Sq Ft
Est. Value
About This Home
This home is located at 6 Chelseas Walk, Ithaca, NY 14850 and is currently estimated at $684,983, approximately $264 per square foot. 6 Chelseas Walk is a home located in Tompkins County with nearby schools including Beverly J. Martin Elementary School, DeWitt Middle School, and Ithaca Senior High School.
Ownership History
Date
Name
Owned For
Owner Type
Purchase Details
Closed on
Jul 14, 2008
Sold by
Eisenstein Eric M
Bought by
Tauer Janelle
Current Estimated Value
Purchase Details
Closed on
May 30, 2002
Sold by
Hopper Anne B
Bought by
Eisenstein Eric M
Purchase Details
Closed on
Nov 1, 2001
Sold by
Goodrich Theresa D
Bought by
Hopper Anne B
Purchase Details
Closed on
Nov 2, 1998
Sold by
Friedman Bernard
Bought by
Goodrich Theresa and Goodrich Gregory
Create a Home Valuation Report for This Property
The Home Valuation Report is an in-depth analysis detailing your home's value as well as a comparison with similar homes in the area
Home Values in the Area
Average Home Value in this Area
Purchase History
| Date | Buyer | Sale Price | Title Company |
|---|---|---|---|
| Tauer Janelle | $365,000 | Gwen Seaquist | |
| Eisenstein Eric M | $288,000 | Mark Masler | |
| Hopper Anne B | $278,000 | Edwrd Mazza | |
| Goodrich Theresa | $15,200 | -- |
Source: Public Records
Tax History
| Year | Tax Paid | Tax Assessment Tax Assessment Total Assessment is a certain percentage of the fair market value that is determined by local assessors to be the total taxable value of land and additions on the property. | Land | Improvement |
|---|---|---|---|---|
| 2024 | $13,334 | $590,000 | $90,900 | $499,100 |
| 2023 | $11,740 | $475,000 | $90,900 | $384,100 |
| 2022 | $10,123 | $452,000 | $90,900 | $361,100 |
| 2020 | $10,123 | $410,000 | $90,900 | $319,100 |
| 2019 | $3,820 | $410,000 | $90,900 | $319,100 |
| 2018 | $9,485 | $378,000 | $90,900 | $287,100 |
| 2017 | $9,694 | $378,000 | $50,900 | $327,100 |
| 2016 | $9,777 | $378,000 | $50,900 | $327,100 |
| 2015 | -- | $360,000 | $50,900 | $309,100 |
| 2014 | -- | $360,000 | $50,900 | $309,100 |
Source: Public Records
Map
Nearby Homes
Your Personal Tour Guide
Ask me questions while you tour the home.