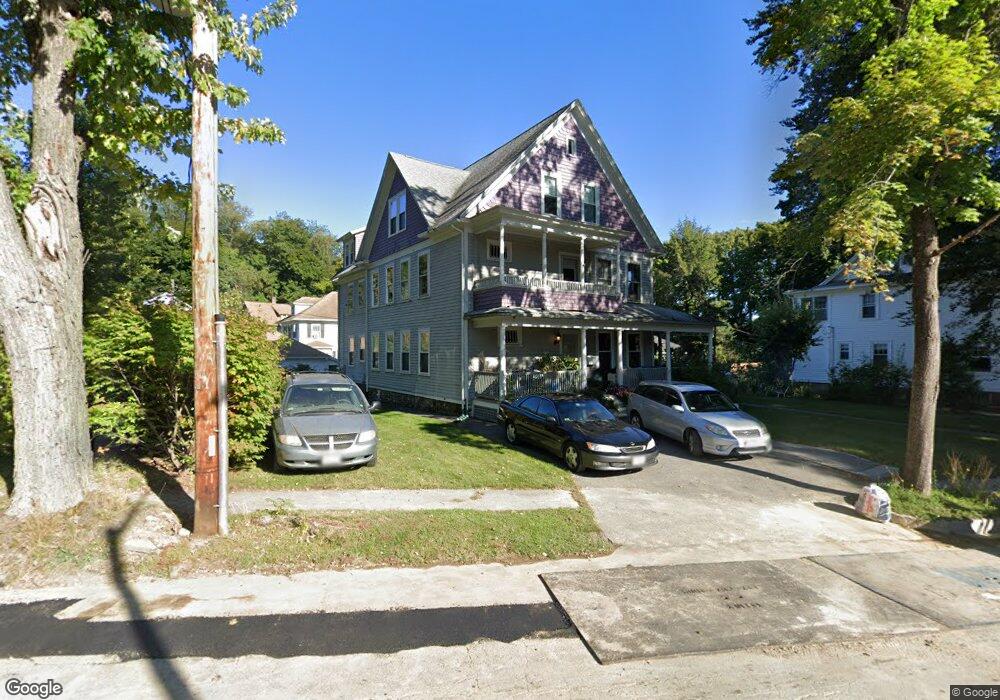
6 Chesterfield Rd Worcester, MA 01602
West Tatnuck NeighborhoodEstimated Value: $636,970 - $812,000
6
Beds
3
Baths
4,135
Sq Ft
$172/Sq Ft
Est. Value
About This Home
This home is located at 6 Chesterfield Rd, Worcester, MA 01602 and is currently estimated at $712,243, approximately $172 per square foot. 6 Chesterfield Rd is a home located in Worcester County with nearby schools including Tatnuck Magnet School, Chandler Magnet, and Jacob Hiatt Magnet School.
Ownership History
Date
Name
Owned For
Owner Type
Purchase Details
Closed on
Aug 10, 2009
Sold by
Martin Roger F
Bought by
Mason Barbara J
Current Estimated Value
Home Financials for this Owner
Home Financials are based on the most recent Mortgage that was taken out on this home.
Original Mortgage
$220,000
Outstanding Balance
$145,332
Interest Rate
5.47%
Mortgage Type
Purchase Money Mortgage
Estimated Equity
$566,911
Purchase Details
Closed on
Mar 11, 2003
Sold by
Martin Richard
Bought by
Martin Roger F
Home Financials for this Owner
Home Financials are based on the most recent Mortgage that was taken out on this home.
Original Mortgage
$189,600
Interest Rate
5.95%
Mortgage Type
Purchase Money Mortgage
Purchase Details
Closed on
May 26, 1994
Sold by
Singh Rt
Bought by
Martin Richard
Home Financials for this Owner
Home Financials are based on the most recent Mortgage that was taken out on this home.
Original Mortgage
$99,420
Interest Rate
8.22%
Mortgage Type
Purchase Money Mortgage
Create a Home Valuation Report for This Property
The Home Valuation Report is an in-depth analysis detailing your home's value as well as a comparison with similar homes in the area
Home Values in the Area
Average Home Value in this Area
Purchase History
| Date | Buyer | Sale Price | Title Company |
|---|---|---|---|
| Mason Barbara J | $275,000 | -- | |
| Martin Roger F | $237,000 | -- | |
| Martin Richard | $124,280 | -- |
Source: Public Records
Mortgage History
| Date | Status | Borrower | Loan Amount |
|---|---|---|---|
| Open | Mason Barbara J | $220,000 | |
| Previous Owner | Martin Richard | $189,600 | |
| Previous Owner | Martin Richard | $86,000 | |
| Previous Owner | Martin Richard | $25,000 | |
| Previous Owner | Martin Richard | $99,420 |
Source: Public Records
Tax History Compared to Growth
Tax History
| Year | Tax Paid | Tax Assessment Tax Assessment Total Assessment is a certain percentage of the fair market value that is determined by local assessors to be the total taxable value of land and additions on the property. | Land | Improvement |
|---|---|---|---|---|
| 2025 | $7,773 | $589,300 | $118,800 | $470,500 |
| 2024 | $7,597 | $552,500 | $118,800 | $433,700 |
| 2023 | $7,022 | $489,700 | $103,300 | $386,400 |
| 2022 | $6,295 | $413,900 | $82,700 | $331,200 |
| 2021 | $5,218 | $320,500 | $66,200 | $254,300 |
| 2020 | $4,916 | $289,200 | $66,100 | $223,100 |
| 2019 | $5,089 | $282,700 | $59,600 | $223,100 |
| 2018 | $4,068 | $215,100 | $59,600 | $155,500 |
| 2017 | $3,884 | $202,100 | $59,600 | $142,500 |
| 2016 | $3,704 | $179,700 | $44,000 | $135,700 |
| 2015 | $4,108 | $204,700 | $44,000 | $160,700 |
| 2014 | $4,000 | $204,700 | $44,000 | $160,700 |
Source: Public Records
Map
Nearby Homes
- 12 Copperfield Rd
- 1029 Pleasant St Unit 19
- 806 Pleasant St
- 40 Rustic Dr
- 12 Merlin Ct
- 980 Pleasant St
- 20 Manhattan Rd
- 40 Walter St
- 563 Chandler St
- 47R Yarnie Unit 3B
- 47R Yarnie Unit 3A
- 47R Yarnie Unit 1B
- 47R Yarnie Unit 2B
- 47R Yarnie Unit 4B
- 47R Yarnie Unit 8B
- 47R Yarnie Unit 5A
- 47R Yarnie Unit 6B
- 47R Yarnie Unit 4A
- 47R Yarnie Unit 1A
- 47R Yarnie Unit 9
- 4 Chesterfield Rd
- 8 Chesterfield Rd
- 21 Beaconsfield Rd
- 17 Beaconsfield Rd
- 2 Chesterfield Rd
- 10 Chesterfield Rd
- 7 Chesterfield Rd
- 5 Chesterfield Rd
- 13 Beaconsfield Rd
- 9 Chesterfield Rd
- 3 Chesterfield Rd
- 26 Beaconsfield Rd
- 11 Chesterfield Rd
- 32 Beaconsfield Rd
- 30-32 Beaconsfield Rd Unit 30-32
- 30-32 Beaconsfield Rd
- 30-32 Beaconsfield Rd Unit 30
- 1061 Pleasant St
- 24 Beaconsfield Rd
- 22 Beaconsfield Rd