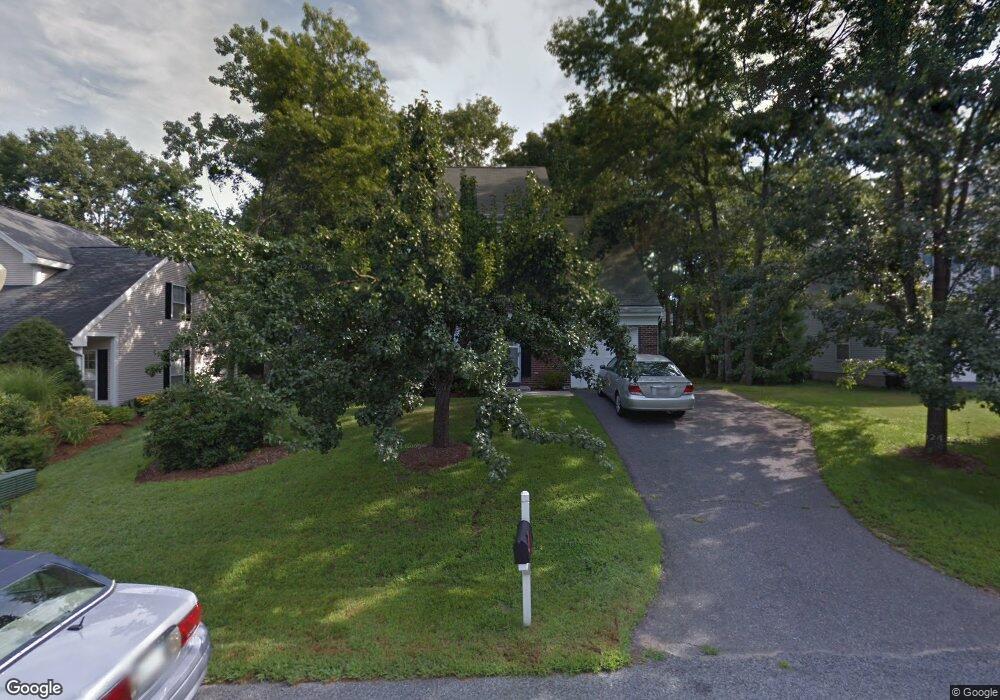
6 Clapp Dr Foxboro, MA 02035
Estimated Value: $620,000 - $776,000
2
Beds
3
Baths
1,845
Sq Ft
$377/Sq Ft
Est. Value
About This Home
This home is located at 6 Clapp Dr, Foxboro, MA 02035 and is currently estimated at $694,872, approximately $376 per square foot. 6 Clapp Dr is a home located in Norfolk County with nearby schools including Foxborough High School, Foxborough Regional Charter School, and The Sage School.
Ownership History
Date
Name
Owned For
Owner Type
Purchase Details
Closed on
May 10, 2018
Sold by
Stanley Roy Est
Bought by
Gemma Stanley Richard M and Gemma Stanley
Current Estimated Value
Home Financials for this Owner
Home Financials are based on the most recent Mortgage that was taken out on this home.
Original Mortgage
$350,000
Outstanding Balance
$301,639
Interest Rate
4.44%
Mortgage Type
New Conventional
Estimated Equity
$393,233
Purchase Details
Closed on
Feb 13, 2014
Sold by
Stanley Eileen
Bought by
Stanley Roy
Purchase Details
Closed on
Jan 4, 2013
Sold by
Stanley Roy and Stanley Eileen
Bought by
Stanley Roy and Stanley Eileen
Create a Home Valuation Report for This Property
The Home Valuation Report is an in-depth analysis detailing your home's value as well as a comparison with similar homes in the area
Home Values in the Area
Average Home Value in this Area
Purchase History
| Date | Buyer | Sale Price | Title Company |
|---|---|---|---|
| Gemma Stanley Richard M | $363,000 | -- | |
| Stanley Roy | -- | -- | |
| Stanley Roy | -- | -- |
Source: Public Records
Mortgage History
| Date | Status | Borrower | Loan Amount |
|---|---|---|---|
| Open | Gemma Stanley Richard M | $350,000 |
Source: Public Records
Tax History
| Year | Tax Paid | Tax Assessment Tax Assessment Total Assessment is a certain percentage of the fair market value that is determined by local assessors to be the total taxable value of land and additions on the property. | Land | Improvement |
|---|---|---|---|---|
| 2025 | $6,803 | $514,600 | $221,000 | $293,600 |
| 2024 | $6,836 | $506,000 | $225,000 | $281,000 |
| 2023 | $6,589 | $463,700 | $214,400 | $249,300 |
| 2022 | $6,033 | $415,500 | $179,700 | $235,800 |
| 2021 | $5,871 | $398,300 | $166,400 | $231,900 |
| 2020 | $5,691 | $390,600 | $166,400 | $224,200 |
| 2019 | $5,467 | $371,900 | $158,500 | $213,400 |
| 2018 | $5,333 | $366,000 | $158,500 | $207,500 |
| 2017 | $5,142 | $341,900 | $148,200 | $193,700 |
| 2016 | $5,146 | $347,200 | $149,300 | $197,900 |
| 2015 | $4,794 | $315,600 | $126,300 | $189,300 |
| 2014 | $4,552 | $303,700 | $118,000 | $185,700 |
Source: Public Records
Map
Nearby Homes
- 132 Cannon Forge Dr
- 9 Independence Dr Unit 9
- 3 Wampanoag Rd
- 1 Maura Elizabeth Ln
- 165 Chestnut St Unit 2
- 147 Chestnut St Unit A
- 147 Chestnut St Unit B
- 2 Foxfire Dr
- 261 East St
- 13 Summerville Rd Unit 13
- 668 S Main St
- 26 Fuller Rd Unit 6
- 233 Central St
- 73 Ridge Rd
- 174 E Foxboro St
- 157 Central St
- 180 Old Post Rd Unit 202
- 180 Old Post Rd Unit 206
- 180 Old Post Rd Unit 308
- 180 Old Post Rd Unit 201
Your Personal Tour Guide
Ask me questions while you tour the home.