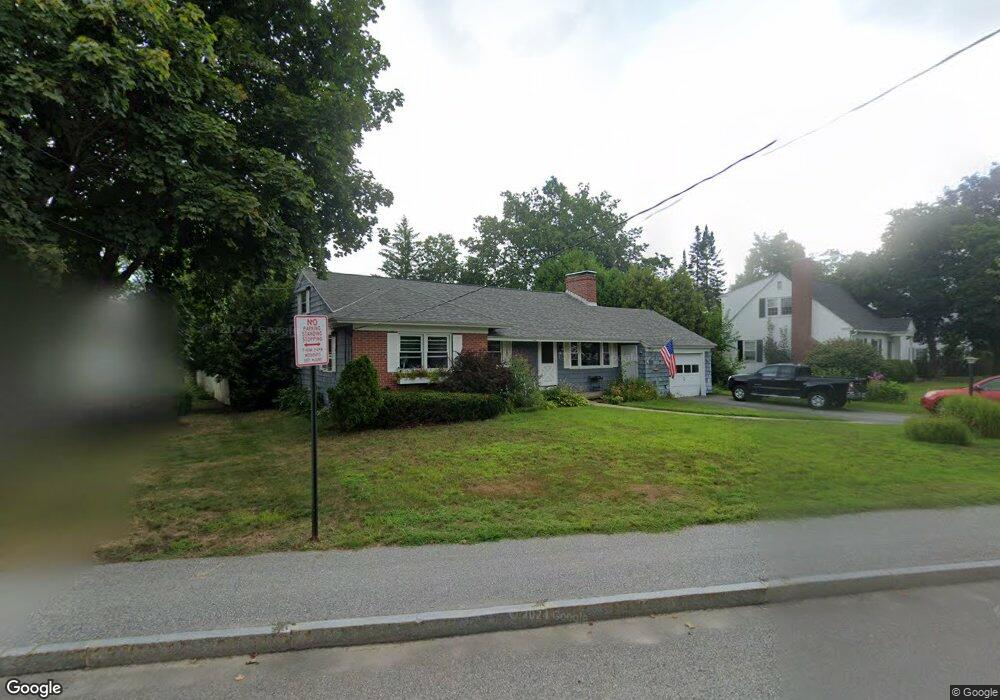
6 Conant Dr Concord, NH 03301
South End NeighborhoodEstimated Value: $442,000 - $521,000
3
Beds
2
Baths
1,321
Sq Ft
$371/Sq Ft
Est. Value
About This Home
This home is located at 6 Conant Dr, Concord, NH 03301 and is currently estimated at $489,480, approximately $370 per square foot. 6 Conant Dr is a home located in Merrimack County with nearby schools including Abbot-Downing School, Rundlett Middle School, and Concord High School.
Ownership History
Date
Name
Owned For
Owner Type
Purchase Details
Closed on
Feb 21, 2006
Sold by
Cricenti Nicholas J and Cricenti Anna D
Bought by
Maltais Albert W and Maltais Donna T
Current Estimated Value
Home Financials for this Owner
Home Financials are based on the most recent Mortgage that was taken out on this home.
Original Mortgage
$191,250
Interest Rate
6.23%
Mortgage Type
Purchase Money Mortgage
Create a Home Valuation Report for This Property
The Home Valuation Report is an in-depth analysis detailing your home's value as well as a comparison with similar homes in the area
Home Values in the Area
Average Home Value in this Area
Purchase History
| Date | Buyer | Sale Price | Title Company |
|---|---|---|---|
| Maltais Albert W | $255,000 | -- | |
| Maltais Danna T | $255,000 | -- |
Source: Public Records
Mortgage History
| Date | Status | Borrower | Loan Amount |
|---|---|---|---|
| Open | Maltais Albert W | $163,200 | |
| Closed | Maltais Danna T | $191,250 |
Source: Public Records
Tax History Compared to Growth
Tax History
| Year | Tax Paid | Tax Assessment Tax Assessment Total Assessment is a certain percentage of the fair market value that is determined by local assessors to be the total taxable value of land and additions on the property. | Land | Improvement |
|---|---|---|---|---|
| 2024 | $8,553 | $308,900 | $112,900 | $196,000 |
| 2023 | $8,297 | $308,900 | $112,900 | $196,000 |
| 2022 | $7,997 | $308,900 | $112,900 | $196,000 |
| 2021 | $7,770 | $309,300 | $112,900 | $196,400 |
| 2020 | $7,418 | $277,200 | $90,200 | $187,000 |
| 2019 | $7,056 | $254,000 | $88,400 | $165,600 |
| 2018 | $6,780 | $240,500 | $88,400 | $152,100 |
| 2017 | $6,506 | $230,400 | $88,400 | $142,000 |
| 2016 | $6,132 | $221,600 | $86,800 | $134,800 |
| 2015 | $5,807 | $203,900 | $90,500 | $113,400 |
| 2014 | $5,467 | $203,900 | $90,500 | $113,400 |
| 2013 | -- | $200,800 | $90,500 | $110,300 |
| 2012 | -- | $193,400 | $90,500 | $102,900 |
Source: Public Records
Map
Nearby Homes