Estimated Value: $315,000 - $388,000
3
Beds
3
Baths
1,684
Sq Ft
$210/Sq Ft
Est. Value
About This Home
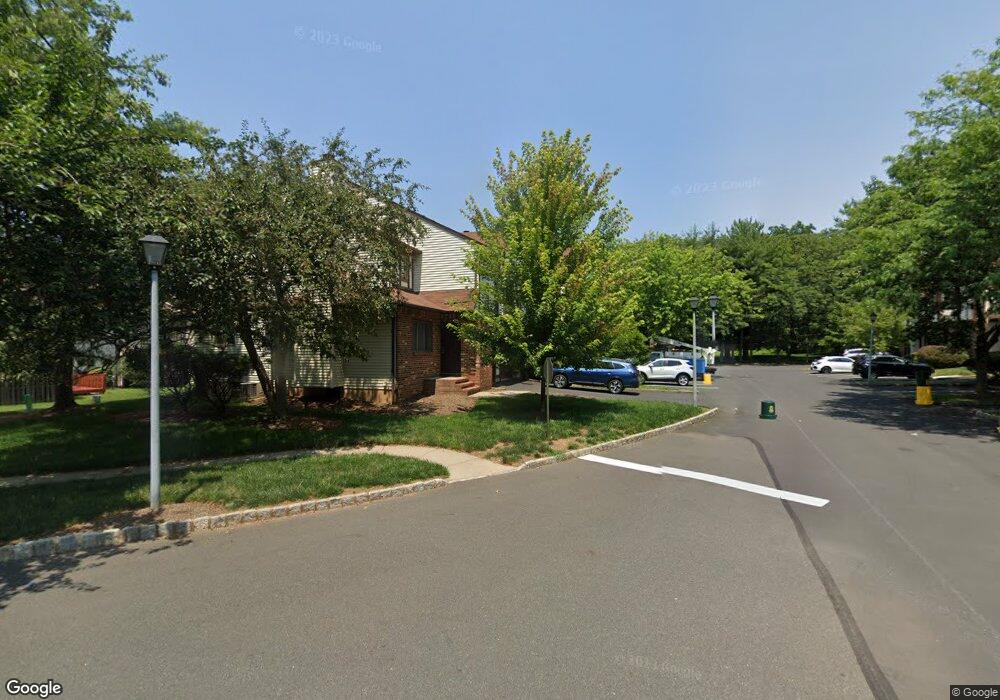
This home is located at 6 Cromwell Ct, Ewing, NJ 08628 and is currently estimated at $353,556, approximately $209 per square foot. 6 Cromwell Ct is a home located in Mercer County with nearby schools including Ewing High School, The Village Charter School, and Abrams Hebrew Academy.
Ownership History
Date
Name
Owned For
Owner Type
Purchase Details
Closed on
Mar 31, 2005
Sold by
Bruno Peter
Bought by
Mckinley James and Mckinley Sherrie
Current Estimated Value
Home Financials for this Owner
Home Financials are based on the most recent Mortgage that was taken out on this home.
Original Mortgage
$240,700
Outstanding Balance
$124,211
Interest Rate
5.78%
Estimated Equity
$229,345
Purchase Details
Closed on
Mar 1, 2005
Home Financials for this Owner
Home Financials are based on the most recent Mortgage that was taken out on this home.
Original Mortgage
$240,700
Outstanding Balance
$124,211
Interest Rate
5.78%
Estimated Equity
$229,345
Purchase Details
Closed on
Sep 28, 2001
Sold by
Straus Jill
Bought by
Bruno Peter
Home Financials for this Owner
Home Financials are based on the most recent Mortgage that was taken out on this home.
Original Mortgage
$142,500
Interest Rate
6.93%
Purchase Details
Closed on
Aug 26, 1988
Sold by
Tamar Heights Inc
Bought by
Straus Lawrence K
Create a Home Valuation Report for This Property
The Home Valuation Report is an in-depth analysis detailing your home's value as well as a comparison with similar homes in the area
Home Values in the Area
Average Home Value in this Area
Purchase History
| Date | Buyer | Sale Price | Title Company |
|---|---|---|---|
| Mckinley James | $253,380 | -- | |
| -- | $253,400 | -- | |
| Bruno Peter | $150,000 | -- | |
| Straus Lawrence K | $110,000 | -- |
Source: Public Records
Mortgage History
| Date | Status | Borrower | Loan Amount |
|---|---|---|---|
| Open | Mckinley James | $240,700 | |
| Previous Owner | Bruno Peter | $142,500 |
Source: Public Records
Tax History
| Year | Tax Paid | Tax Assessment Tax Assessment Total Assessment is a certain percentage of the fair market value that is determined by local assessors to be the total taxable value of land and additions on the property. | Land | Improvement |
|---|---|---|---|---|
| 2025 | $7,473 | $63,100 | $49,000 | $14,100 |
| 2024 | $7,024 | $190,000 | $49,000 | $141,000 |
| 2023 | $7,024 | $190,000 | $49,000 | $141,000 |
| 2022 | $6,834 | $190,000 | $49,000 | $141,000 |
| 2021 | $6,667 | $190,000 | $49,000 | $141,000 |
| 2020 | $6,572 | $190,000 | $49,000 | $141,000 |
| 2019 | $6,401 | $190,000 | $49,000 | $141,000 |
| 2018 | $5,557 | $105,200 | $24,900 | $80,300 |
| 2017 | $5,686 | $105,200 | $24,900 | $80,300 |
| 2016 | $5,609 | $105,200 | $24,900 | $80,300 |
| 2015 | $5,535 | $105,200 | $24,900 | $80,300 |
| 2014 | $5,520 | $105,200 | $24,900 | $80,300 |
Source: Public Records
Map
Nearby Homes
- 15 Leicester Ln
- 8 Beckett Ct
- 5 Tudor Ct
- 7 Balamor Ln
- 1 Devonshire Ct
- 2 Devonshire Ct
- 61 Willis Dr
- 5 Pioneer Ct
- 21 Pioneer Ct
- 22 Crockett Ln
- 18 Pioneer Ct
- 1048 River Rd
- 4 Birch Run Ct
- 18 Westwood Dr
- 182 W Upper Ferry Rd
- 11 Mountain View Rd
- 0 First Ave
- 4 Riverview Dr
- 1155 Mount Eyre Rd
- 36 Lochatong Rd
Your Personal Tour Guide
Ask me questions while you tour the home.