Estimated Value: $617,275 - $841,000
4
Beds
3
Baths
2,234
Sq Ft
$340/Sq Ft
Est. Value
About This Home
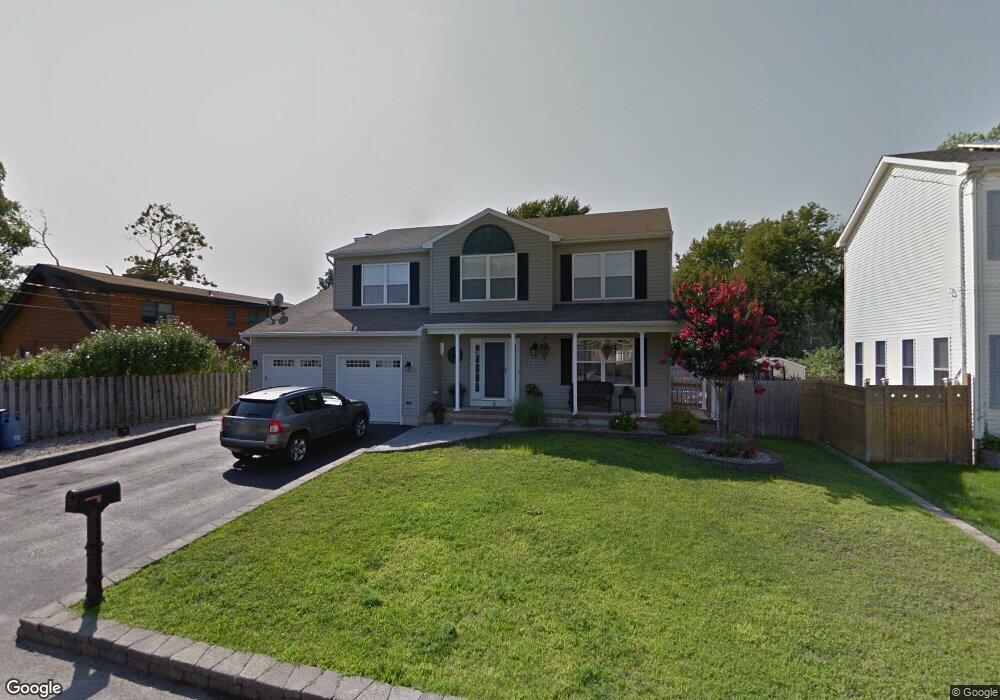
This home is located at 6 Cross Trees Rd, Brick, NJ 08723 and is currently estimated at $759,319, approximately $339 per square foot. 6 Cross Trees Rd is a home located in Ocean County with nearby schools including Drum Point Road Elementary School, Lake Riviera Middle School, and Brick Township High School.
Ownership History
Date
Name
Owned For
Owner Type
Purchase Details
Closed on
Apr 5, 2005
Sold by
Garkowski John and Cornacchio Mia
Bought by
Cornacchio Mia
Current Estimated Value
Home Financials for this Owner
Home Financials are based on the most recent Mortgage that was taken out on this home.
Original Mortgage
$180,000
Outstanding Balance
$93,430
Interest Rate
5.87%
Mortgage Type
New Conventional
Estimated Equity
$665,889
Purchase Details
Closed on
Apr 30, 1999
Sold by
Home Mark Homes
Bought by
Garkowski John and Garkowski Mia
Home Financials for this Owner
Home Financials are based on the most recent Mortgage that was taken out on this home.
Original Mortgage
$157,990
Interest Rate
6.95%
Create a Home Valuation Report for This Property
The Home Valuation Report is an in-depth analysis detailing your home's value as well as a comparison with similar homes in the area
Home Values in the Area
Average Home Value in this Area
Purchase History
| Date | Buyer | Sale Price | Title Company |
|---|---|---|---|
| Cornacchio Mia | -- | Counsellors Title Agency Inc | |
| Garkowski John | $197,496 | -- |
Source: Public Records
Mortgage History
| Date | Status | Borrower | Loan Amount |
|---|---|---|---|
| Open | Cornacchio Mia | $180,000 | |
| Closed | Garkowski John | $157,990 |
Source: Public Records
Tax History
| Year | Tax Paid | Tax Assessment Tax Assessment Total Assessment is a certain percentage of the fair market value that is determined by local assessors to be the total taxable value of land and additions on the property. | Land | Improvement |
|---|---|---|---|---|
| 2025 | $8,836 | $342,100 | $140,000 | $202,100 |
| 2024 | $8,399 | $342,100 | $140,000 | $202,100 |
| 2023 | $8,289 | $342,100 | $140,000 | $202,100 |
| 2022 | $8,289 | $342,100 | $140,000 | $202,100 |
| 2021 | $7,995 | $342,100 | $140,000 | $202,100 |
| 2020 | $8,012 | $342,100 | $140,000 | $202,100 |
| 2019 | $7,879 | $342,100 | $140,000 | $202,100 |
| 2018 | $7,697 | $342,100 | $140,000 | $202,100 |
| 2017 | $7,489 | $342,100 | $140,000 | $202,100 |
| 2016 | $7,451 | $342,100 | $140,000 | $202,100 |
| 2015 | $7,256 | $342,100 | $140,000 | $202,100 |
| 2014 | $7,198 | $342,100 | $140,000 | $202,100 |
Source: Public Records
Map
Nearby Homes
- 25 Boom Ln
- 89 Club House Rd
- 126 Royal Dr
- 150 Royal Dr
- 5 Bay Way
- 114 Mizzen Rd
- 22 Queen Ann Rd
- 34 Blue Cedar Dr
- 165 Royal Dr
- 224 Kettle Creek Rd
- 226 Kettle Creek Rd
- 46 Bay Harbor Blvd
- 36 Bay Way
- 34 Greenville Dr
- 219 Kettle Creek Rd
- 240 Timberline Rd
- 215 Kettle Creek Rd
- 244 Atsion Way
- 141 Vanard Dr
- 4 Palm Ave
Your Personal Tour Guide
Ask me questions while you tour the home.