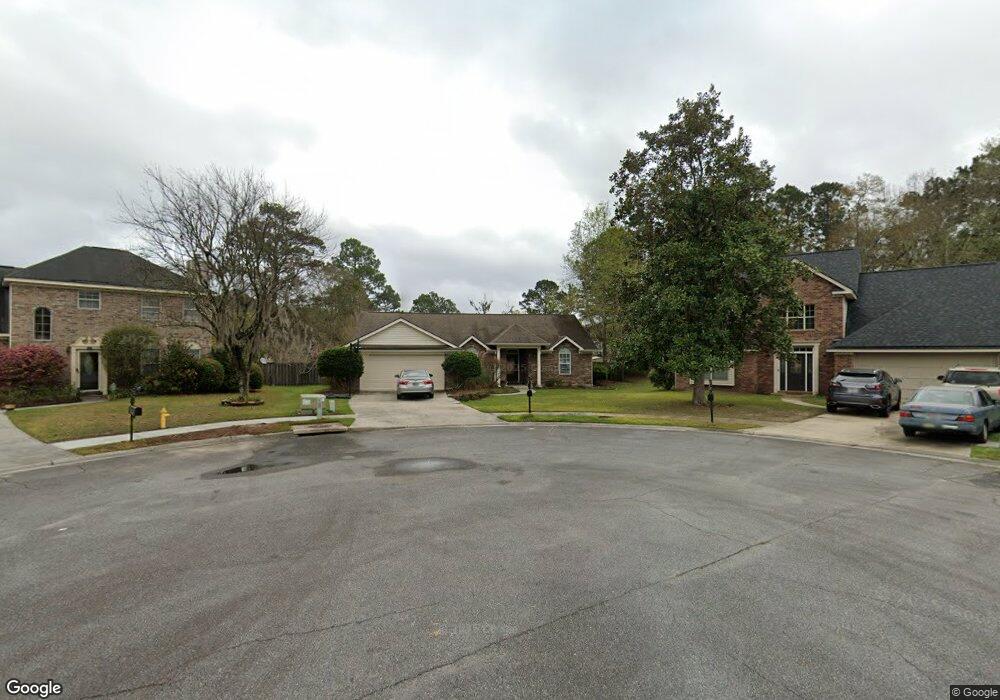
6 Davenport Ln Savannah, GA 31419
Estimated Value: $343,119 - $366,000
4
Beds
2
Baths
2,034
Sq Ft
$174/Sq Ft
Est. Value
About This Home
This home is located at 6 Davenport Ln, Savannah, GA 31419 and is currently estimated at $353,780, approximately $173 per square foot. 6 Davenport Ln is a home located in Chatham County with nearby schools including Windsor Forest High School, Georgetown School, and Butler Academy.
Ownership History
Date
Name
Owned For
Owner Type
Purchase Details
Closed on
May 7, 2021
Sold by
Hooker David M
Bought by
Hall Emily and Hall Jared A
Current Estimated Value
Home Financials for this Owner
Home Financials are based on the most recent Mortgage that was taken out on this home.
Original Mortgage
$231,000
Outstanding Balance
$209,344
Interest Rate
3.1%
Mortgage Type
New Conventional
Estimated Equity
$144,436
Purchase Details
Closed on
Jan 27, 2005
Sold by
Lewis Wendy K
Bought by
Hooker David M and Hooker Leslie B
Home Financials for this Owner
Home Financials are based on the most recent Mortgage that was taken out on this home.
Original Mortgage
$180,400
Interest Rate
5.72%
Mortgage Type
New Conventional
Purchase Details
Closed on
Jan 17, 2005
Sold by
Not Provided
Bought by
Hooker David M and Hooker Leslie B
Home Financials for this Owner
Home Financials are based on the most recent Mortgage that was taken out on this home.
Original Mortgage
$180,400
Interest Rate
5.72%
Mortgage Type
New Conventional
Create a Home Valuation Report for This Property
The Home Valuation Report is an in-depth analysis detailing your home's value as well as a comparison with similar homes in the area
Home Values in the Area
Average Home Value in this Area
Purchase History
| Date | Buyer | Sale Price | Title Company |
|---|---|---|---|
| Hall Emily | $256,000 | -- | |
| Hooker David M | $189,900 | -- | |
| Hooker David M | $189,900 | -- | |
| Hooker David M | $189,900 | -- |
Source: Public Records
Mortgage History
| Date | Status | Borrower | Loan Amount |
|---|---|---|---|
| Open | Hall Emily | $231,000 | |
| Previous Owner | Hooker David M | $180,400 |
Source: Public Records
Tax History Compared to Growth
Tax History
| Year | Tax Paid | Tax Assessment Tax Assessment Total Assessment is a certain percentage of the fair market value that is determined by local assessors to be the total taxable value of land and additions on the property. | Land | Improvement |
|---|---|---|---|---|
| 2025 | $2,877 | $114,200 | $30,000 | $84,200 |
| 2024 | $2,877 | $92,080 | $20,400 | $71,680 |
| 2023 | $2,080 | $98,200 | $20,400 | $77,800 |
| 2022 | $2,590 | $90,640 | $20,400 | $70,240 |
| 2021 | $2,869 | $80,400 | $20,400 | $60,000 |
| 2020 | $2,315 | $68,920 | $20,400 | $48,520 |
| 2019 | $2,429 | $70,280 | $20,400 | $49,880 |
| 2018 | $2,113 | $69,120 | $20,400 | $48,720 |
| 2017 | $2,085 | $69,560 | $20,400 | $49,160 |
| 2016 | $2,157 | $69,600 | $20,400 | $49,200 |
| 2015 | $1,932 | $62,760 | $20,400 | $42,360 |
| 2014 | $2,831 | $63,440 | $0 | $0 |
Source: Public Records
Map
Nearby Homes
- 112 Lions Gate Rd
- 2 Saint Ives Dr
- 120 Dukes Way
- 17 Mallorys Way
- 38 Cutler Dr
- 45 Barrington Cir
- 10 Barrington Cir
- 2 +/- AC Fawn Ln
- 56 Red Fox Dr
- 167 Wild Heron Villas Rd
- 127 Iron Horse Spur
- 114 Snowbell Ct
- 112 Snowbell Ct
- 110 Snowbell Ct
- 65 Red Fox Dr
- 108 Snowbell Ct
- 105 Laurens Ln
- 101 Laurens Ln
- 103 Snowbell Ct
- 101 Snowbell Ct
- 7 Davenport Ln
- 4 Davenport Ln
- 5 Davenport Ln
- 106 Lions Gate Rd
- 3 Davenport Ln
- 104 Lions Gate Rd
- 1 Davenport Ln
- 6 William Jay Ct
- 1 Dukes Way
- 4 William Jay Ct
- 8 William Jay Ct
- 105 Lions Gate Rd
- 109 Lions Gate Rd
- 107 Lions Gate Rd
- 111 Lions Gate Rd
- 103 Lions Gate Rd
- 34 Dukes Way
- 113 Lions Gate Rd
- 101 Lions Gate Rd
- 115 Chalice Way