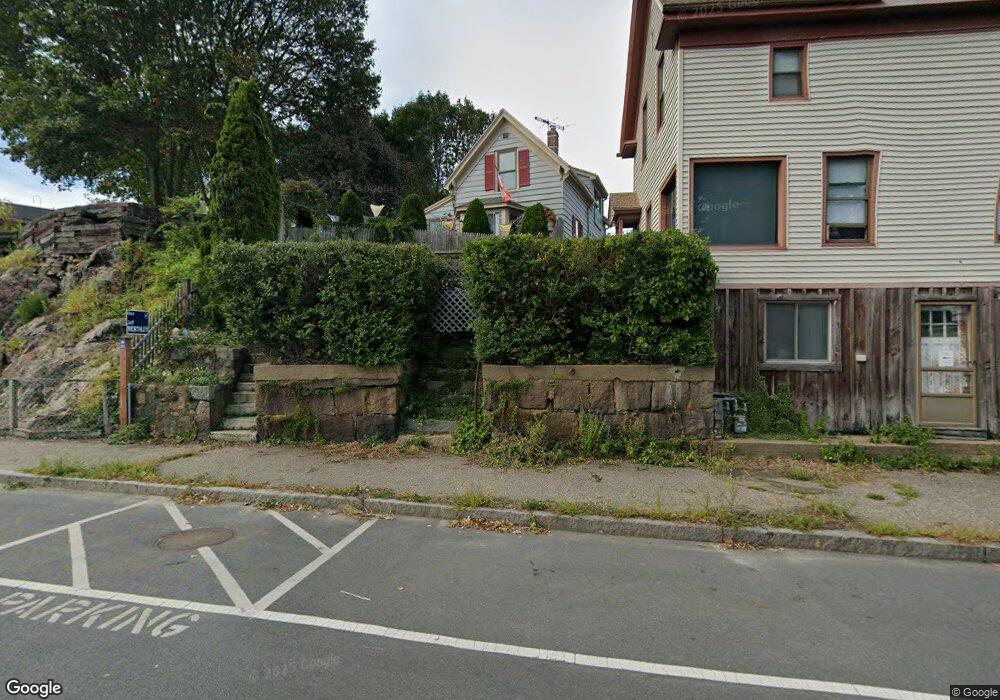
6 E Main St Gloucester, MA 01930
Central Gloucester NeighborhoodEstimated Value: $424,000 - $493,000
2
Beds
1
Bath
806
Sq Ft
$574/Sq Ft
Est. Value
About This Home
This home is located at 6 E Main St, Gloucester, MA 01930 and is currently estimated at $462,532, approximately $573 per square foot. 6 E Main St is a home located in Essex County with nearby schools including East Veterans Memorial Elementary, Ralph B O'maley Middle School, and Gloucester High School.
Ownership History
Date
Name
Owned For
Owner Type
Purchase Details
Closed on
Nov 27, 1991
Sold by
Niagara Rt
Bought by
Hanson Edward A
Current Estimated Value
Home Financials for this Owner
Home Financials are based on the most recent Mortgage that was taken out on this home.
Original Mortgage
$74,100
Interest Rate
8.72%
Mortgage Type
Purchase Money Mortgage
Create a Home Valuation Report for This Property
The Home Valuation Report is an in-depth analysis detailing your home's value as well as a comparison with similar homes in the area
Home Values in the Area
Average Home Value in this Area
Purchase History
| Date | Buyer | Sale Price | Title Company |
|---|---|---|---|
| Hanson Edward A | $78,000 | -- |
Source: Public Records
Mortgage History
| Date | Status | Borrower | Loan Amount |
|---|---|---|---|
| Open | Hanson Edward A | $88,750 | |
| Closed | Hanson Edward A | $71,000 | |
| Closed | Hanson Edward A | $74,100 |
Source: Public Records
Tax History
| Year | Tax Paid | Tax Assessment Tax Assessment Total Assessment is a certain percentage of the fair market value that is determined by local assessors to be the total taxable value of land and additions on the property. | Land | Improvement |
|---|---|---|---|---|
| 2025 | $3,359 | $345,600 | $130,300 | $215,300 |
| 2024 | $3,302 | $339,400 | $124,100 | $215,300 |
| 2023 | $3,164 | $298,800 | $110,800 | $188,000 |
| 2022 | $3,059 | $260,800 | $96,300 | $164,500 |
| 2021 | $2,951 | $237,200 | $87,600 | $149,600 |
| 2020 | $2,848 | $231,000 | $87,600 | $143,400 |
| 2019 | $2,661 | $209,700 | $87,600 | $122,100 |
| 2018 | $2,512 | $194,300 | $87,600 | $106,700 |
| 2017 | $2,435 | $184,600 | $83,400 | $101,200 |
| 2016 | $2,360 | $173,400 | $87,000 | $86,400 |
| 2015 | $2,275 | $166,700 | $87,000 | $79,700 |
Source: Public Records
Map
Nearby Homes
- 36 Eastern Ave
- 3 Mondello Square
- 5 Wise Place
- 139A Prospect St
- 15 Mount Vernon St
- 26 Marina Dr
- 197 E Main St Unit 1
- 19 Trask St Unit 2
- 50 Warner St
- 191 Main St Unit 3
- 191 Main St Unit 2A
- 113 Pleasant St
- 40 Sargent St
- 60 Rocky Neck Ave Unit 202
- 73 Rocky Neck Ave Unit 2
- 33 Maplewood Ave Unit 310
- 12 Arthur St
- 9 Cleveland Place
- 35 Middle St Unit 4
- 33 Middle St
Your Personal Tour Guide
Ask me questions while you tour the home.