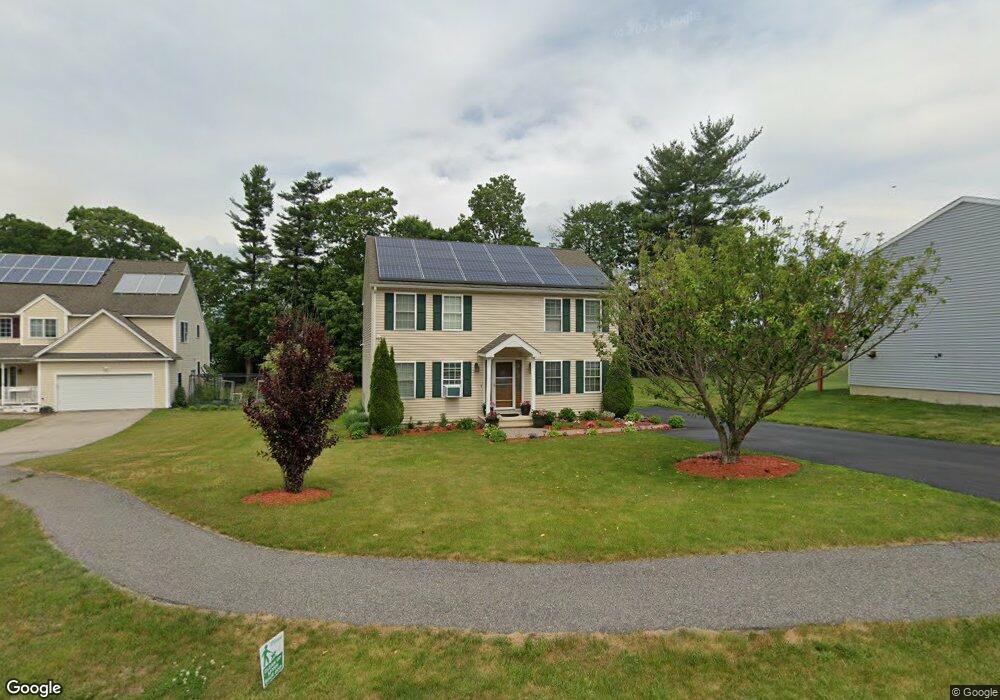
6 Eastview Dr Worcester, MA 01602
Webster Square NeighborhoodEstimated Value: $487,000 - $570,000
3
Beds
2
Baths
1,664
Sq Ft
$309/Sq Ft
Est. Value
About This Home
This home is located at 6 Eastview Dr, Worcester, MA 01602 and is currently estimated at $514,821, approximately $309 per square foot. 6 Eastview Dr is a home located in Worcester County with nearby schools including Tatnuck Magnet School, Chandler Magnet, and Jacob Hiatt Magnet School.
Ownership History
Date
Name
Owned For
Owner Type
Purchase Details
Closed on
Mar 31, 2003
Sold by
Hilltop Sec Rt and Campbell Stephen E
Bought by
Bruno Elliote and Bruno Marie
Current Estimated Value
Home Financials for this Owner
Home Financials are based on the most recent Mortgage that was taken out on this home.
Original Mortgage
$199,405
Outstanding Balance
$86,669
Interest Rate
5.91%
Mortgage Type
Purchase Money Mortgage
Estimated Equity
$428,152
Create a Home Valuation Report for This Property
The Home Valuation Report is an in-depth analysis detailing your home's value as well as a comparison with similar homes in the area
Home Values in the Area
Average Home Value in this Area
Purchase History
| Date | Buyer | Sale Price | Title Company |
|---|---|---|---|
| Bruno Elliote | $209,900 | -- |
Source: Public Records
Mortgage History
| Date | Status | Borrower | Loan Amount |
|---|---|---|---|
| Open | Bruno Elliote | $199,405 |
Source: Public Records
Tax History Compared to Growth
Tax History
| Year | Tax Paid | Tax Assessment Tax Assessment Total Assessment is a certain percentage of the fair market value that is determined by local assessors to be the total taxable value of land and additions on the property. | Land | Improvement |
|---|---|---|---|---|
| 2025 | $5,384 | $408,200 | $98,700 | $309,500 |
| 2024 | $5,258 | $382,400 | $98,700 | $283,700 |
| 2023 | $5,112 | $356,500 | $85,800 | $270,700 |
| 2022 | $4,685 | $308,000 | $68,600 | $239,400 |
| 2021 | $4,591 | $282,000 | $54,900 | $227,100 |
| 2020 | $4,505 | $265,000 | $54,500 | $210,500 |
| 2019 | $4,313 | $239,600 | $47,700 | $191,900 |
| 2018 | $4,266 | $225,600 | $47,700 | $177,900 |
| 2017 | $4,086 | $212,600 | $47,700 | $164,900 |
| 2016 | $4,097 | $198,800 | $34,300 | $164,500 |
| 2015 | $3,990 | $198,800 | $34,300 | $164,500 |
| 2014 | $3,885 | $198,800 | $34,300 | $164,500 |
Source: Public Records
Map
Nearby Homes