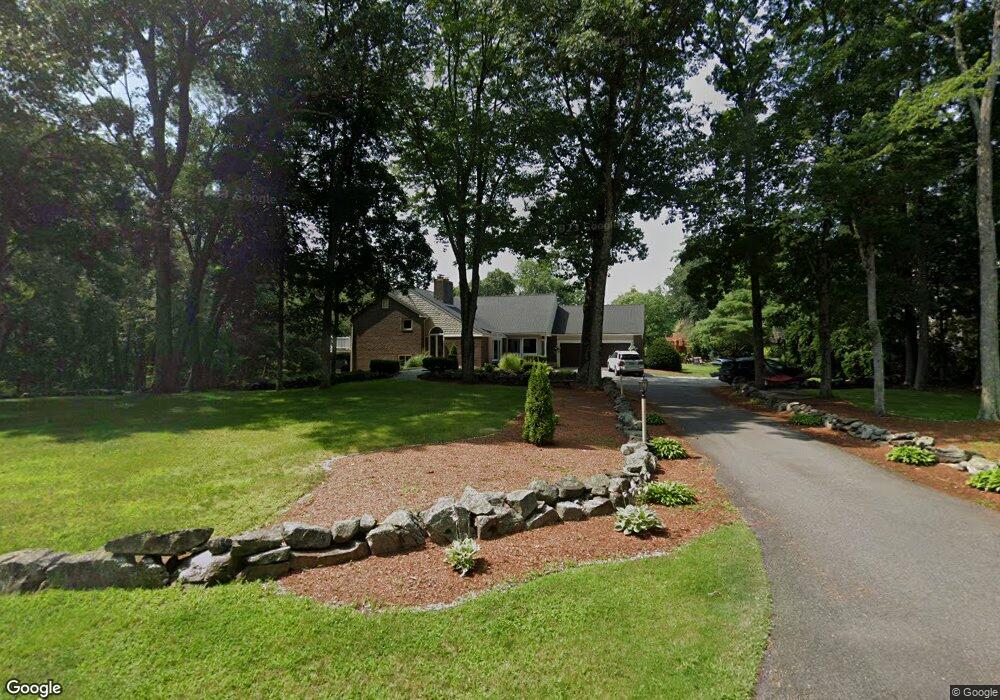
6 Edgewood Rd Windham, NH 03087
Estimated Value: $761,637 - $906,000
4
Beds
5
Baths
3,486
Sq Ft
$242/Sq Ft
Est. Value
About This Home
This home is located at 6 Edgewood Rd, Windham, NH 03087 and is currently estimated at $844,909, approximately $242 per square foot. 6 Edgewood Rd is a home located in Rockingham County with nearby schools including Golden Brook Elementary School, Windham Middle School, and Windham High School.
Ownership History
Date
Name
Owned For
Owner Type
Purchase Details
Closed on
Aug 25, 2016
Sold by
Randy A Currier T and Currier Randy A
Bought by
Regan Richard A and Regan Angela M
Current Estimated Value
Home Financials for this Owner
Home Financials are based on the most recent Mortgage that was taken out on this home.
Original Mortgage
$424,297
Outstanding Balance
$336,938
Interest Rate
3.25%
Mortgage Type
FHA
Estimated Equity
$507,971
Purchase Details
Closed on
Jul 20, 2015
Sold by
Currier Randy A
Bought by
Randy A Currier T
Purchase Details
Closed on
Sep 12, 1997
Sold by
Pelletier Robert P C and Pelletier Ruth
Bought by
Currier Randy A and Currier Diane I
Home Financials for this Owner
Home Financials are based on the most recent Mortgage that was taken out on this home.
Original Mortgage
$211,500
Interest Rate
7.31%
Create a Home Valuation Report for This Property
The Home Valuation Report is an in-depth analysis detailing your home's value as well as a comparison with similar homes in the area
Home Values in the Area
Average Home Value in this Area
Purchase History
| Date | Buyer | Sale Price | Title Company |
|---|---|---|---|
| Regan Richard A | $442,000 | -- | |
| Randy A Currier T | -- | -- | |
| Currier Randy A | $235,000 | -- |
Source: Public Records
Mortgage History
| Date | Status | Borrower | Loan Amount |
|---|---|---|---|
| Open | Regan Richard A | $424,297 | |
| Previous Owner | Currier Randy A | $100,000 | |
| Previous Owner | Currier Randy A | $389,000 | |
| Previous Owner | Currier Randy A | $211,500 |
Source: Public Records
Tax History
| Year | Tax Paid | Tax Assessment Tax Assessment Total Assessment is a certain percentage of the fair market value that is determined by local assessors to be the total taxable value of land and additions on the property. | Land | Improvement |
|---|---|---|---|---|
| 2024 | $11,121 | $491,200 | $196,100 | $295,100 |
| 2023 | $10,512 | $491,200 | $196,100 | $295,100 |
| 2022 | $9,718 | $491,800 | $196,100 | $295,700 |
| 2021 | $9,157 | $491,800 | $196,100 | $295,700 |
| 2020 | $9,408 | $491,800 | $196,100 | $295,700 |
| 2019 | $8,542 | $378,800 | $179,500 | $199,300 |
| 2018 | $7,345 | $378,800 | $179,500 | $199,300 |
| 2017 | $7,652 | $378,800 | $179,500 | $199,300 |
| 2016 | $8,265 | $378,800 | $179,500 | $199,300 |
| 2015 | $8,228 | $378,800 | $179,500 | $199,300 |
| 2014 | $7,651 | $318,800 | $183,000 | $135,800 |
| 2013 | $7,347 | $311,300 | $183,000 | $128,300 |
Source: Public Records
Map
Nearby Homes
Your Personal Tour Guide
Ask me questions while you tour the home.