Estimated Value: $954,518 - $1,029,000
4
Beds
4
Baths
2,509
Sq Ft
$395/Sq Ft
Est. Value
About This Home
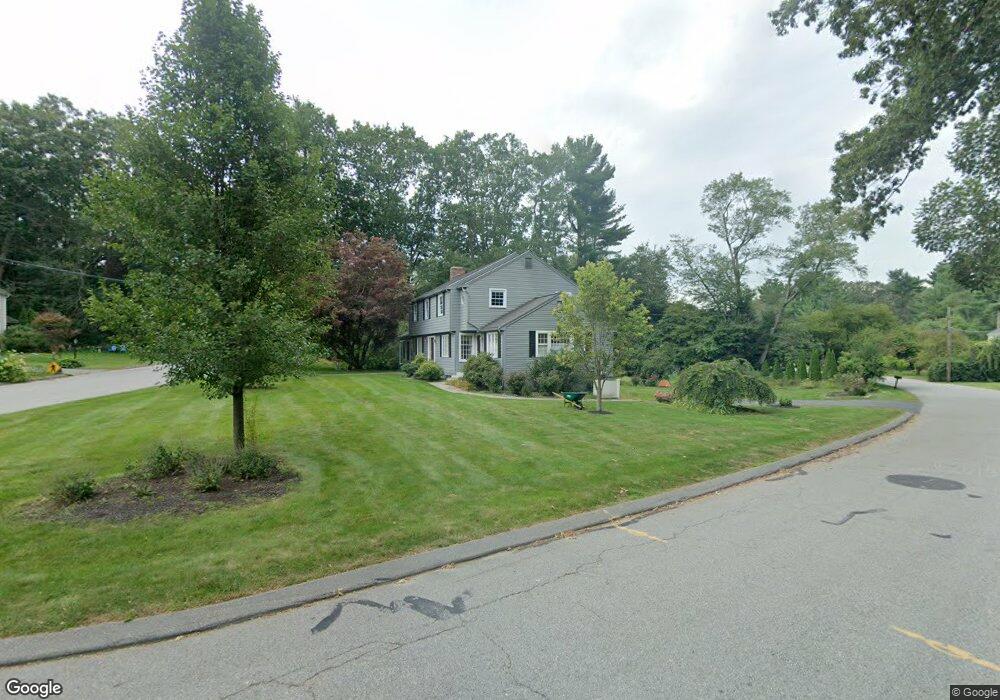
This home is located at 6 Emerson Dr Unit 8, Acton, MA 01720 and is currently estimated at $990,880, approximately $394 per square foot. 6 Emerson Dr Unit 8 is a home located in Middlesex County with nearby schools including Acton-Boxborough Regional High School and Concord Academy.
Ownership History
Date
Name
Owned For
Owner Type
Purchase Details
Closed on
Sep 29, 2017
Sold by
Zubick Howard H and Zubick Phyllis M
Bought by
Shah Rachana M and Goswami Aditya
Current Estimated Value
Home Financials for this Owner
Home Financials are based on the most recent Mortgage that was taken out on this home.
Original Mortgage
$340,000
Outstanding Balance
$284,527
Interest Rate
3.89%
Mortgage Type
New Conventional
Estimated Equity
$706,353
Purchase Details
Closed on
Sep 22, 1972
Bought by
Zubick Howard H
Create a Home Valuation Report for This Property
The Home Valuation Report is an in-depth analysis detailing your home's value as well as a comparison with similar homes in the area
Home Values in the Area
Average Home Value in this Area
Purchase History
| Date | Buyer | Sale Price | Title Company |
|---|---|---|---|
| Shah Rachana M | $661,000 | -- | |
| Zubick Howard H | -- | -- |
Source: Public Records
Mortgage History
| Date | Status | Borrower | Loan Amount |
|---|---|---|---|
| Open | Shah Rachana M | $340,000 | |
| Previous Owner | Zubick Howard H | $35,000 |
Source: Public Records
Tax History
| Year | Tax Paid | Tax Assessment Tax Assessment Total Assessment is a certain percentage of the fair market value that is determined by local assessors to be the total taxable value of land and additions on the property. | Land | Improvement |
|---|---|---|---|---|
| 2025 | $14,185 | $827,100 | $342,100 | $485,000 |
| 2024 | $13,278 | $796,500 | $342,100 | $454,400 |
| 2023 | $12,942 | $737,000 | $311,000 | $426,000 |
| 2022 | $12,469 | $641,100 | $270,300 | $370,800 |
| 2021 | $12,172 | $601,700 | $250,300 | $351,400 |
| 2020 | $11,482 | $596,800 | $250,300 | $346,500 |
| 2019 | $10,975 | $566,600 | $250,300 | $316,300 |
| 2018 | $10,791 | $556,800 | $250,300 | $306,500 |
| 2017 | $10,517 | $551,800 | $250,300 | $301,500 |
| 2016 | $10,478 | $544,900 | $250,300 | $294,600 |
| 2015 | $10,237 | $537,400 | $250,300 | $287,100 |
| 2014 | $9,908 | $509,400 | $250,300 | $259,100 |
Source: Public Records
Map
Nearby Homes
Your Personal Tour Guide
Ask me questions while you tour the home.