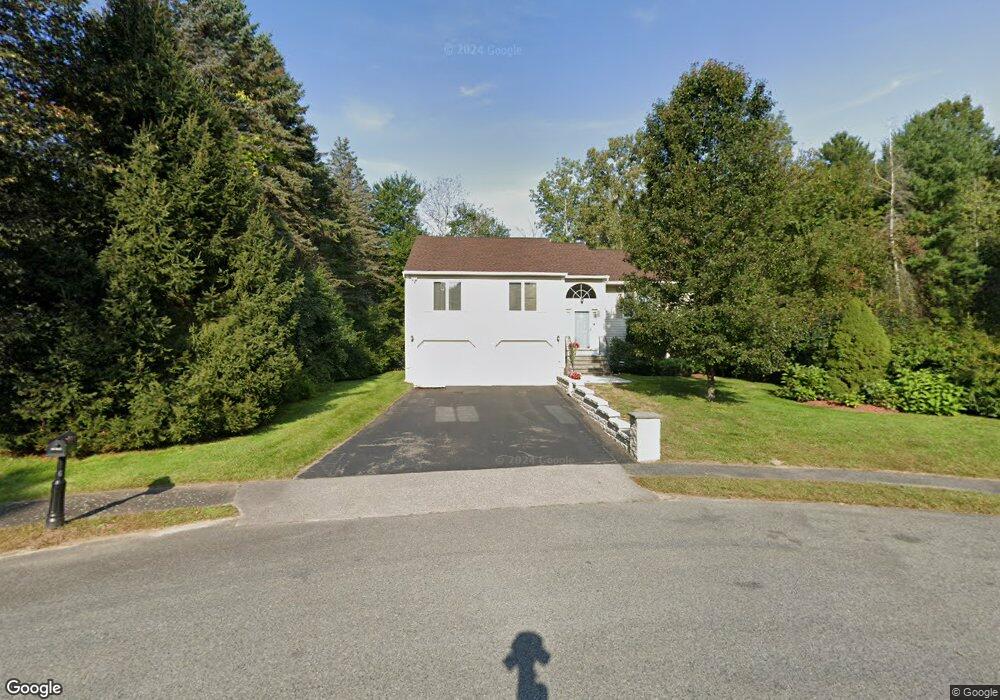
6 Ernest Dr Natick, MA 01760
Estimated Value: $964,795 - $1,272,000
3
Beds
3
Baths
1,624
Sq Ft
$725/Sq Ft
Est. Value
About This Home
This home is located at 6 Ernest Dr, Natick, MA 01760 and is currently estimated at $1,176,699, approximately $724 per square foot. 6 Ernest Dr is a home located in Middlesex County with nearby schools including Natick High School, Memorial Elementary School, and J F Kennedy Middle School.
Ownership History
Date
Name
Owned For
Owner Type
Purchase Details
Closed on
Apr 17, 2025
Sold by
Wheeler Jane M
Bought by
Wheeler Lt and Wheeler
Current Estimated Value
Purchase Details
Closed on
Mar 24, 1994
Sold by
Vogel Stephen F and Vogel Sandra
Bought by
Wheeler Richard M and Wheeler Jane M
Create a Home Valuation Report for This Property
The Home Valuation Report is an in-depth analysis detailing your home's value as well as a comparison with similar homes in the area
Home Values in the Area
Average Home Value in this Area
Purchase History
| Date | Buyer | Sale Price | Title Company |
|---|---|---|---|
| Wheeler Lt | -- | None Available | |
| Wheeler Lt | -- | None Available | |
| Wheeler Richard M | $105,000 | -- | |
| Wheeler Richard M | $105,000 | -- |
Source: Public Records
Mortgage History
| Date | Status | Borrower | Loan Amount |
|---|---|---|---|
| Previous Owner | Wheeler Richard M | $185,000 | |
| Previous Owner | Wheeler Richard M | $130,000 |
Source: Public Records
Tax History
| Year | Tax Paid | Tax Assessment Tax Assessment Total Assessment is a certain percentage of the fair market value that is determined by local assessors to be the total taxable value of land and additions on the property. | Land | Improvement |
|---|---|---|---|---|
| 2025 | $11,545 | $965,300 | $570,200 | $395,100 |
| 2024 | $11,196 | $913,200 | $539,100 | $374,100 |
| 2023 | $11,102 | $878,300 | $538,200 | $340,100 |
| 2022 | $10,164 | $761,900 | $437,800 | $324,100 |
| 2021 | $4,148 | $718,200 | $414,300 | $303,900 |
| 2020 | $9,534 | $700,500 | $396,600 | $303,900 |
| 2019 | $23,354 | $700,500 | $396,600 | $303,900 |
| 2018 | $5,159 | $646,400 | $379,700 | $266,700 |
| 2017 | $8,102 | $600,600 | $307,600 | $293,000 |
| 2016 | $8,112 | $597,800 | $307,600 | $290,200 |
| 2015 | $7,535 | $545,200 | $307,600 | $237,600 |
Source: Public Records
Map
Nearby Homes
Your Personal Tour Guide
Ask me questions while you tour the home.