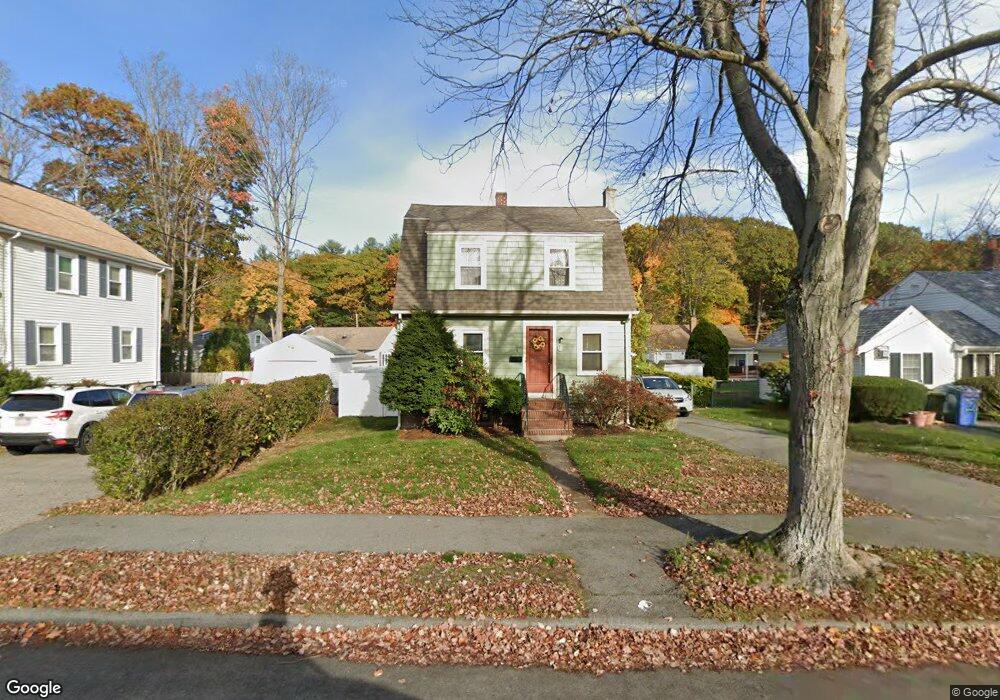
6 Fell St Wakefield, MA 01880
Greenwood NeighborhoodEstimated Value: $768,441 - $826,000
3
Beds
1
Bath
1,893
Sq Ft
$420/Sq Ft
Est. Value
About This Home
This home is located at 6 Fell St, Wakefield, MA 01880 and is currently estimated at $794,610, approximately $419 per square foot. 6 Fell St is a home located in Middlesex County with nearby schools including Wakefield Memorial High School, St Joseph School, and St. Patrick Elementary School.
Ownership History
Date
Name
Owned For
Owner Type
Purchase Details
Closed on
Mar 27, 1989
Sold by
Schiavo Michael
Bought by
Bond Allan
Current Estimated Value
Home Financials for this Owner
Home Financials are based on the most recent Mortgage that was taken out on this home.
Original Mortgage
$120,000
Interest Rate
10.49%
Mortgage Type
Purchase Money Mortgage
Create a Home Valuation Report for This Property
The Home Valuation Report is an in-depth analysis detailing your home's value as well as a comparison with similar homes in the area
Home Values in the Area
Average Home Value in this Area
Purchase History
| Date | Buyer | Sale Price | Title Company |
|---|---|---|---|
| Bond Allan | $212,000 | -- |
Source: Public Records
Mortgage History
| Date | Status | Borrower | Loan Amount |
|---|---|---|---|
| Open | Bond Allan | $135,000 | |
| Closed | Bond Allan | $120,000 |
Source: Public Records
Tax History
| Year | Tax Paid | Tax Assessment Tax Assessment Total Assessment is a certain percentage of the fair market value that is determined by local assessors to be the total taxable value of land and additions on the property. | Land | Improvement |
|---|---|---|---|---|
| 2025 | $7,906 | $696,600 | $348,600 | $348,000 |
| 2024 | $7,292 | $648,200 | $324,300 | $323,900 |
| 2023 | $7,099 | $605,200 | $302,600 | $302,600 |
| 2022 | $6,661 | $540,700 | $270,200 | $270,500 |
| 2021 | $6,245 | $490,600 | $247,100 | $243,500 |
| 2020 | $5,872 | $459,800 | $231,600 | $228,200 |
| 2019 | $5,507 | $429,200 | $216,200 | $213,000 |
| 2018 | $5,310 | $410,000 | $206,500 | $203,500 |
| 2017 | $4,993 | $383,200 | $193,000 | $190,200 |
| 2016 | $5,057 | $374,900 | $190,600 | $184,300 |
| 2015 | $4,723 | $350,400 | $178,000 | $172,400 |
| 2014 | $4,369 | $341,900 | $173,700 | $168,200 |
Source: Public Records
Map
Nearby Homes
- 824 Main St Unit 1
- 1 Sidney St
- 0 Everett St
- 62 Golden Hills Rd
- 34 Stark Ave
- 15 Belmont Rd
- 61 Nahant St
- 9 Lovis Ave
- 7 West St
- 12 Lovis Ave
- 176 Bay State Rd
- 24 Mount Zion Rd
- 21 Herbert St Unit A
- 1 Traverse St Unit E
- 11 Ludlow Ave
- 38 Morgan Ave
- 98 Boardman Ave
- 35 Richardson St Unit 2
- 129 Greenwood St
- 350 Water St
Your Personal Tour Guide
Ask me questions while you tour the home.