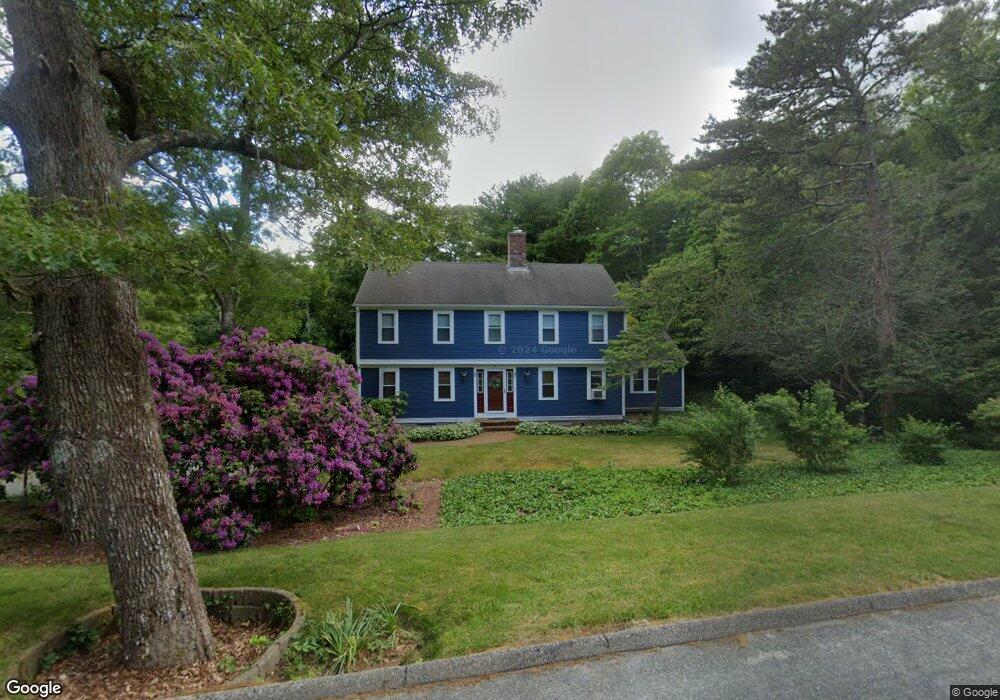
6 Fox Run Unit 6D East Sandwich, MA 02537
Estimated Value: $787,000 - $945,000
3
Beds
2
Baths
1,456
Sq Ft
$583/Sq Ft
Est. Value
About This Home
This home is located at 6 Fox Run Unit 6D, East Sandwich, MA 02537 and is currently estimated at $848,269, approximately $582 per square foot. 6 Fox Run Unit 6D is a home located in Barnstable County with nearby schools including Sandwich Middle High School and Riverview School.
Ownership History
Date
Name
Owned For
Owner Type
Purchase Details
Closed on
Oct 18, 2022
Sold by
Zf 2021-1 Llc
Bought by
Zf Spv Llc
Current Estimated Value
Purchase Details
Closed on
Feb 5, 2016
Sold by
Firmin Michael S and Firmin Anita I
Bought by
Rothman David and Rothman Margaret L
Home Financials for this Owner
Home Financials are based on the most recent Mortgage that was taken out on this home.
Original Mortgage
$325,000
Interest Rate
3.98%
Mortgage Type
New Conventional
Purchase Details
Closed on
Jun 13, 2003
Sold by
Dellaposta Gary M and Dellaposta Nancy R
Bought by
Firmin Michael S and Firmin Anita I
Home Financials for this Owner
Home Financials are based on the most recent Mortgage that was taken out on this home.
Original Mortgage
$304,000
Interest Rate
5.77%
Mortgage Type
Purchase Money Mortgage
Purchase Details
Closed on
Dec 1, 1992
Sold by
Kearns Robert J and Kearns Deborah A
Bought by
Firmin Michael S and Firmin Anita I
Create a Home Valuation Report for This Property
The Home Valuation Report is an in-depth analysis detailing your home's value as well as a comparison with similar homes in the area
Home Values in the Area
Average Home Value in this Area
Purchase History
| Date | Buyer | Sale Price | Title Company |
|---|---|---|---|
| Zf Spv Llc | -- | None Available | |
| Rothman David | $415,000 | -- | |
| Firmin Michael S | $475,000 | -- | |
| Firmin Michael S | $90,000 | -- |
Source: Public Records
Mortgage History
| Date | Status | Borrower | Loan Amount |
|---|---|---|---|
| Previous Owner | Rothman David | $325,000 | |
| Previous Owner | Firmin Michael S | $251,000 | |
| Previous Owner | Firmin Michael S | $304,000 |
Source: Public Records
Tax History Compared to Growth
Tax History
| Year | Tax Paid | Tax Assessment Tax Assessment Total Assessment is a certain percentage of the fair market value that is determined by local assessors to be the total taxable value of land and additions on the property. | Land | Improvement |
|---|---|---|---|---|
| 2025 | $6,863 | $649,300 | $136,600 | $512,700 |
| 2024 | $6,816 | $631,100 | $122,000 | $509,100 |
| 2023 | $6,486 | $564,000 | $110,900 | $453,100 |
| 2022 | $6,459 | $490,800 | $125,400 | $365,400 |
| 2021 | $6,135 | $445,500 | $120,600 | $324,900 |
| 2020 | $6,183 | $432,100 | $124,000 | $308,100 |
| 2019 | $5,964 | $416,500 | $127,800 | $288,700 |
| 2018 | $6,049 | $385,900 | $117,500 | $268,400 |
| 2017 | $5,697 | $381,600 | $130,800 | $250,800 |
| 2016 | $5,341 | $369,100 | $126,100 | $243,000 |
| 2015 | $5,263 | $355,100 | $116,600 | $238,500 |
Source: Public Records
Map
Nearby Homes
- 6 Harpers Hollow
- 11 Locust Ln
- 50 Wayside Ln
- 665 Route 6a
- 665 Old King's Hwy
- 58 Williams Path
- 120 Berkshire Trail
- 41 Coventry Ln
- 75 Old Toll Rd
- 566 Route 6a
- 3 Mulberry Cir
- 205 Carlson Ln
- 7 Oak Ridge Rd
- 515 Cedar St
- 159 Great Hill Rd
- 0 Captain Kidd Rd
- 70 Wing Blvd E
- 507 Massachusetts 6a Unit 9
- 12 Pine Terrace
- 339 Cedar St