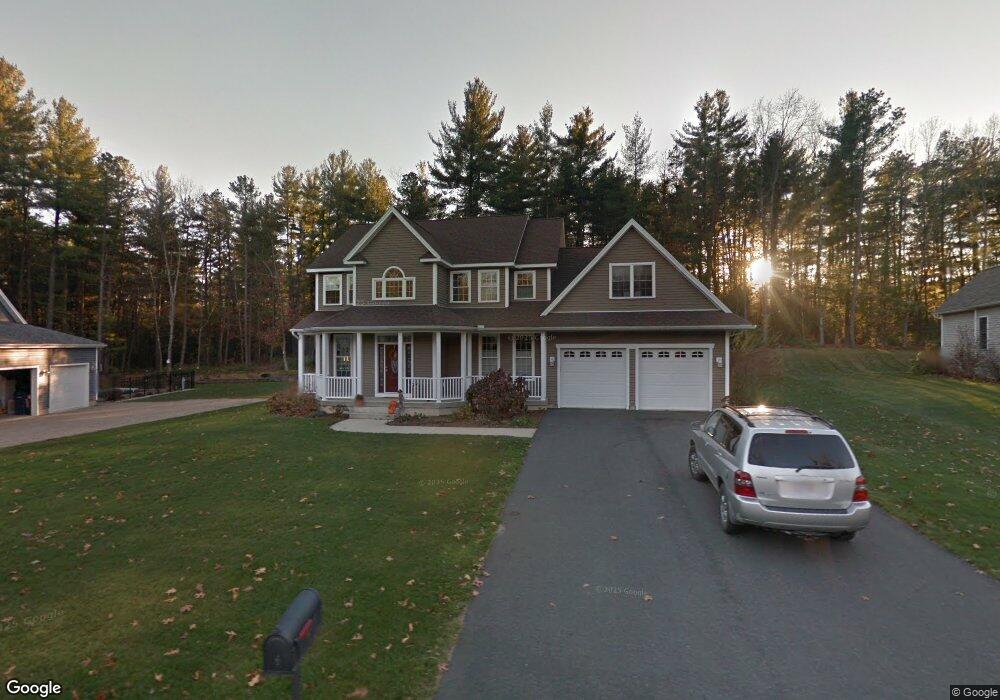
6 Fox Run Easthampton, MA 01027
Estimated Value: $712,000 - $956,558
3
Beds
3
Baths
2,330
Sq Ft
$358/Sq Ft
Est. Value
About This Home
This home is located at 6 Fox Run, Easthampton, MA 01027 and is currently estimated at $833,640, approximately $357 per square foot. 6 Fox Run is a home located in Hampshire County with nearby schools including Easthampton High School, Tri-County Schools, and New England Adolescent Research Institute.
Ownership History
Date
Name
Owned For
Owner Type
Purchase Details
Closed on
Aug 23, 2023
Sold by
Lehane Amy M and Gundersen Jennifer A
Bought by
Lehane Amy M
Current Estimated Value
Purchase Details
Closed on
Mar 29, 2011
Sold by
David A Hardy Contract
Bought by
Gundersen Jennifer A and Lehane Amy M
Home Financials for this Owner
Home Financials are based on the most recent Mortgage that was taken out on this home.
Original Mortgage
$332,800
Interest Rate
5.07%
Mortgage Type
Purchase Money Mortgage
Create a Home Valuation Report for This Property
The Home Valuation Report is an in-depth analysis detailing your home's value as well as a comparison with similar homes in the area
Home Values in the Area
Average Home Value in this Area
Purchase History
| Date | Buyer | Sale Price | Title Company |
|---|---|---|---|
| Lehane Amy M | -- | None Available | |
| Gundersen Jennifer A | $416,000 | -- |
Source: Public Records
Mortgage History
| Date | Status | Borrower | Loan Amount |
|---|---|---|---|
| Previous Owner | Gundersen Jennifer A | $328,000 | |
| Previous Owner | Gundersen Jennifer A | $332,800 | |
| Previous Owner | Gundersen Jennifer A | $336,000 |
Source: Public Records
Tax History
| Year | Tax Paid | Tax Assessment Tax Assessment Total Assessment is a certain percentage of the fair market value that is determined by local assessors to be the total taxable value of land and additions on the property. | Land | Improvement |
|---|---|---|---|---|
| 2025 | $8,270 | $0 | $0 | $0 |
| 2024 | $8,270 | $609,900 | $128,500 | $481,400 |
| 2023 | $7,955 | $543,000 | $116,600 | $426,400 |
| 2022 | $0 | $0 | $0 | $0 |
| 2021 | $7,628 | $434,900 | $101,300 | $333,600 |
| 2020 | $7,418 | $417,700 | $101,300 | $316,400 |
| 2019 | $6,615 | $427,900 | $118,300 | $309,600 |
| 2018 | $6,355 | $397,200 | $111,700 | $285,500 |
| 2017 | $6,197 | $382,300 | $107,100 | $275,200 |
| 2016 | $6,049 | $388,000 | $107,100 | $280,900 |
| 2015 | $5,878 | $388,000 | $107,100 | $280,900 |
Source: Public Records
Map
Nearby Homes
Your Personal Tour Guide
Ask me questions while you tour the home.