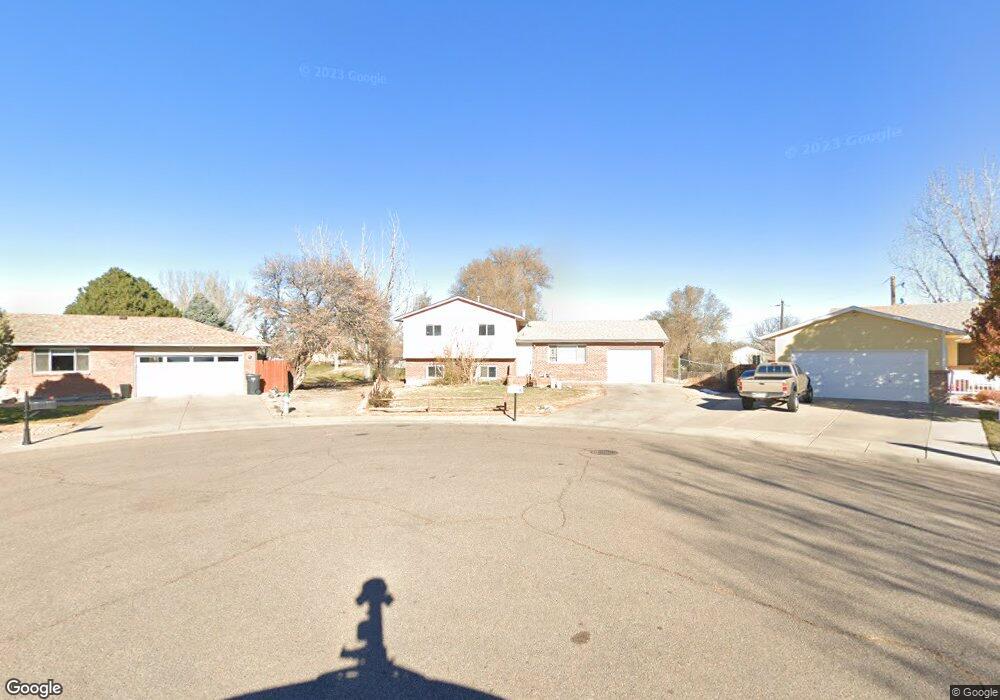
6 Gem Ct Pueblo, CO 81005
Beulah Heights NeighborhoodEstimated Value: $252,000 - $328,000
3
Beds
3
Baths
1,140
Sq Ft
$254/Sq Ft
Est. Value
About This Home
This home is located at 6 Gem Ct, Pueblo, CO 81005 and is currently estimated at $290,075, approximately $254 per square foot. 6 Gem Ct is a home located in Pueblo County with nearby schools including Beulah Heights Elementary School, Roncalli STEM Academy, and South High School.
Ownership History
Date
Name
Owned For
Owner Type
Purchase Details
Closed on
Nov 9, 2007
Sold by
Dipietro Joseph A
Bought by
Front Range Capital Management Inc
Current Estimated Value
Purchase Details
Closed on
Aug 7, 2007
Sold by
Front Range Capital Management Ltd
Bought by
Fip Holdings Llc
Purchase Details
Closed on
Nov 17, 2003
Sold by
Sage Partners Llc
Bought by
Dipietro Joseph A
Purchase Details
Closed on
Oct 10, 2003
Sold by
Eller S C S and Eller Spicola T
Bought by
Sage Partners Llc
Purchase Details
Closed on
Oct 8, 2003
Sold by
Casias Lexine E
Bought by
Eller S C S and Eller Spicola T
Purchase Details
Closed on
Dec 7, 2000
Sold by
Casias Lexine E and Vigil Olivama
Bought by
Casias Lexine E
Purchase Details
Closed on
Jun 3, 1983
Sold by
Same
Bought by
Casias Lexine E and Vigil Olivama
Purchase Details
Closed on
Nov 10, 1982
Sold by
Jones-Healy Conts
Bought by
Casias Lexine E
Purchase Details
Closed on
Jan 2, 1980
Sold by
Jones-Healy Inc
Bought by
Jones-Healy Conts
Create a Home Valuation Report for This Property
The Home Valuation Report is an in-depth analysis detailing your home's value as well as a comparison with similar homes in the area
Home Values in the Area
Average Home Value in this Area
Purchase History
| Date | Buyer | Sale Price | Title Company |
|---|---|---|---|
| Front Range Capital Management Inc | -- | None Available | |
| Fip Holdings Llc | -- | None Available | |
| Dipietro Joseph A | $100,000 | -- | |
| Sage Partners Llc | $100,000 | -- | |
| Eller S C S | -- | -- | |
| Casias Lexine E | -- | -- | |
| Casias Lexine E | $60,000 | -- | |
| Casias Lexine E | $10,000 | -- | |
| Jones-Healy Conts | -- | -- |
Source: Public Records
Tax History Compared to Growth
Tax History
| Year | Tax Paid | Tax Assessment Tax Assessment Total Assessment is a certain percentage of the fair market value that is determined by local assessors to be the total taxable value of land and additions on the property. | Land | Improvement |
|---|---|---|---|---|
| 2024 | $1,385 | $14,120 | -- | -- |
| 2023 | $1,401 | $17,810 | $1,340 | $16,470 |
| 2022 | $1,323 | $13,324 | $1,390 | $11,934 |
| 2021 | $1,365 | $13,710 | $1,430 | $12,280 |
| 2020 | $1,035 | $13,710 | $1,430 | $12,280 |
| 2019 | $1,036 | $10,258 | $1,073 | $9,185 |
| 2018 | $843 | $9,302 | $1,080 | $8,222 |
| 2017 | $851 | $9,302 | $1,080 | $8,222 |
| 2016 | $849 | $9,341 | $1,194 | $8,147 |
| 2015 | $423 | $9,341 | $1,194 | $8,147 |
| 2014 | $383 | $8,443 | $1,194 | $7,249 |
Source: Public Records
Map
Nearby Homes
- 3061 Oneal Ave
- 3361 Oneal Ave
- 75 Wheatridge Dr
- 2531 Delphinium St
- 2521 Emilia St
- 2221 S Prairie Ave Unit 106
- 2221 S Prairie Ave Unit 150
- 2221 S Prairie Ave Unit 36
- 2221 S Prairie Ave Unit 59
- 2127 S Prairie Ave
- 2019 Emilia St
- 2622 Holmes St
- 2021 Lynwood Ln
- 2416 Winnipeg St
- 2029 Hollywood Dr
- 3505 Wapiti Ln
- 2610 Hollywood Dr
- 1824 Moore Ave
- 2513 Ontario St
- 2426 Ontario St