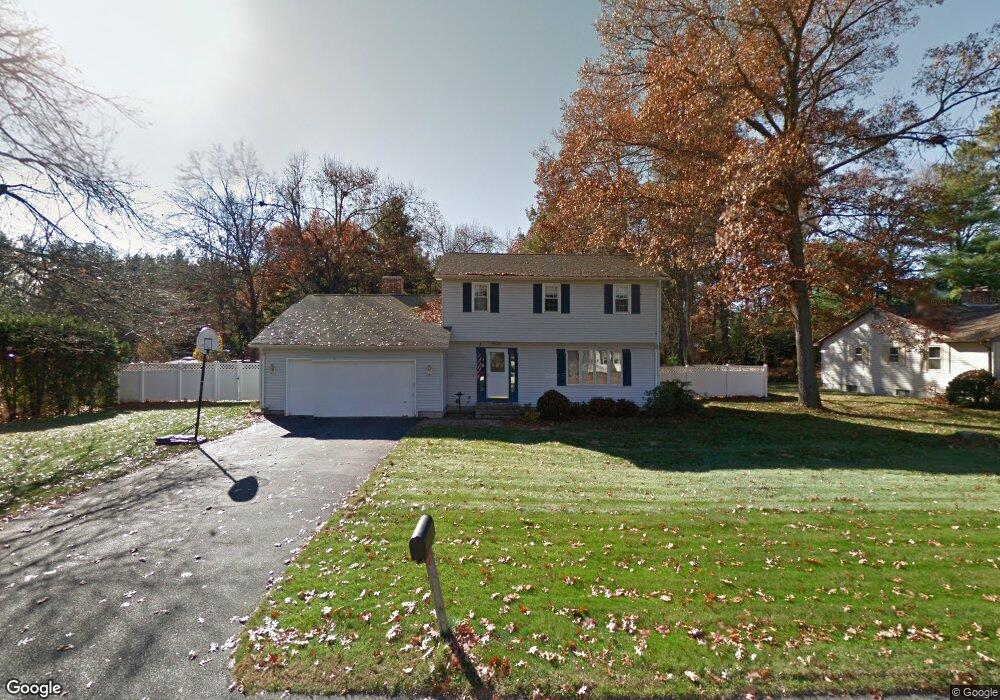
6 Golden Dr Easthampton, MA 01027
Estimated Value: $506,815 - $574,000
3
Beds
3
Baths
1,972
Sq Ft
$271/Sq Ft
Est. Value
About This Home
This home is located at 6 Golden Dr, Easthampton, MA 01027 and is currently estimated at $535,204, approximately $271 per square foot. 6 Golden Dr is a home located in Hampshire County with nearby schools including Easthampton High School, Calvary Baptist Christian School, and Tri-County Schools.
Ownership History
Date
Name
Owned For
Owner Type
Purchase Details
Closed on
Sep 23, 2003
Sold by
Sullivan Laurie E and Sullivan Michael E
Bought by
Sullivan Michael E
Current Estimated Value
Home Financials for this Owner
Home Financials are based on the most recent Mortgage that was taken out on this home.
Original Mortgage
$170,000
Outstanding Balance
$79,243
Interest Rate
6.31%
Mortgage Type
Purchase Money Mortgage
Estimated Equity
$455,961
Purchase Details
Closed on
Jul 1, 1991
Sold by
Laroche Marianne and Lorenzatti Sandra J
Bought by
Sullivan Laurie E and Sullivan Michael E
Create a Home Valuation Report for This Property
The Home Valuation Report is an in-depth analysis detailing your home's value as well as a comparison with similar homes in the area
Home Values in the Area
Average Home Value in this Area
Purchase History
We collect this data history from publicly available records. To have your information removed, we recommend requesting removal directly through your county’s website.
| Date | Buyer | Sale Price | Title Company |
|---|---|---|---|
| Sullivan Michael E | -- | -- | |
| Sullivan Michael E | -- | -- | |
| Sullivan Laurie E | $158,900 | -- |
Source: Public Records
Mortgage History
We collect this data history from publicly available records. To have your information removed, we recommend requesting removal directly through your county’s website.
| Date | Status | Borrower | Loan Amount |
|---|---|---|---|
| Open | Sullivan Michael E | $170,000 | |
| Closed | Sullivan Laurie E | $170,000 | |
| Previous Owner | Sullivan Laurie E | $25,000 | |
| Previous Owner | Sullivan Laurie E | $19,800 | |
| Previous Owner | Sullivan Laurie E | $130,000 |
Source: Public Records
Tax History
| Year | Tax Paid | Tax Assessment Tax Assessment Total Assessment is a certain percentage of the fair market value that is determined by local assessors to be the total taxable value of land and additions on the property. | Land | Improvement |
|---|---|---|---|---|
| 2025 | $6,460 | $472,600 | $135,500 | $337,100 |
| 2024 | $6,318 | $465,900 | $131,600 | $334,300 |
| 2023 | $4,755 | $324,600 | $103,700 | $220,900 |
| 2022 | $5,366 | $324,600 | $103,700 | $220,900 |
| 2021 | $5,900 | $336,400 | $103,700 | $232,700 |
| 2020 | $5,765 | $324,600 | $103,700 | $220,900 |
| 2019 | $5,215 | $337,300 | $121,100 | $216,200 |
| 2018 | $5,024 | $314,000 | $114,300 | $199,700 |
| 2017 | $4,902 | $302,400 | $109,800 | $192,600 |
| 2016 | $4,714 | $302,400 | $109,800 | $192,600 |
| 2015 | $4,581 | $302,400 | $109,800 | $192,600 |
Source: Public Records
Map
Nearby Homes
- 36 & 36R Holly Cir
- 19 Beyer Dr
- 12 Pomeroy St
- 7 Western View Rd
- 33 Labrie Ln
- 48 Gunn Rd
- 123 Holyoke St
- 52-54 Holyoke St
- 85 Garfield Ave
- 28 Winter St Unit 28
- 27 Holyoke St
- 359 Main St Unit 1B
- 27 Mount Tom Ave
- 26 Mount Tom Ave
- M143 &152 Glendale St
- 17 Adams St
- 17 Olympia St
- 55 Longfellow Rd
- 6 Pine Wood Dr
- 20 Meadowbrook Dr
Your Personal Tour Guide
Ask me questions while you tour the home.