Estimated Value: $1,481,000 - $1,812,000
4
Beds
4
Baths
5,096
Sq Ft
$335/Sq Ft
Est. Value
About This Home
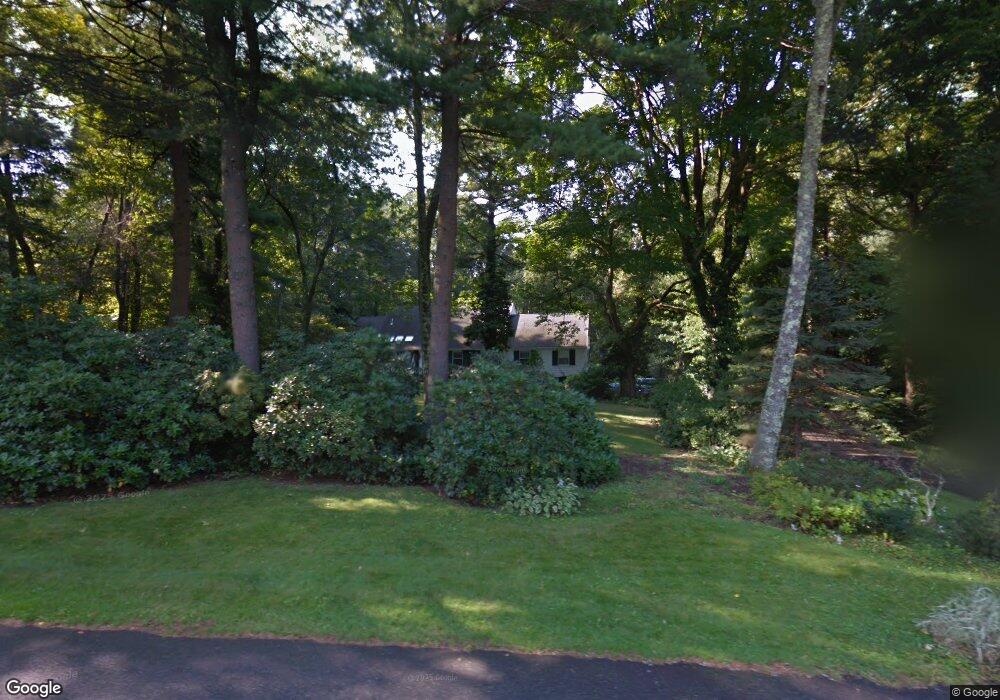
This home is located at 6 Greystone Rd, Dover, MA 02030 and is currently estimated at $1,706,717, approximately $334 per square foot. 6 Greystone Rd is a home located in Norfolk County with nearby schools including Chickering Elementary School, Dover-Sherborn Regional Middle School, and Dover-Sherborn Regional High School.
Ownership History
Date
Name
Owned For
Owner Type
Purchase Details
Closed on
Oct 31, 2003
Sold by
Bramson Howard N and Bramson Carol E
Bought by
Thisse Gilbert M and Thisse Jerilynn C
Current Estimated Value
Home Financials for this Owner
Home Financials are based on the most recent Mortgage that was taken out on this home.
Original Mortgage
$322,700
Interest Rate
6.05%
Mortgage Type
Purchase Money Mortgage
Purchase Details
Closed on
Jun 27, 2000
Sold by
Waalewyn John W and Waalewyn Martha J
Bought by
Bramson Howard N and Bramson Carol E
Create a Home Valuation Report for This Property
The Home Valuation Report is an in-depth analysis detailing your home's value as well as a comparison with similar homes in the area
Home Values in the Area
Average Home Value in this Area
Purchase History
| Date | Buyer | Sale Price | Title Company |
|---|---|---|---|
| Thisse Gilbert M | $855,000 | -- | |
| Bramson Howard N | $750,000 | -- |
Source: Public Records
Mortgage History
| Date | Status | Borrower | Loan Amount |
|---|---|---|---|
| Open | Bramson Howard N | $314,000 | |
| Closed | Bramson Howard N | $322,700 |
Source: Public Records
Tax History
| Year | Tax Paid | Tax Assessment Tax Assessment Total Assessment is a certain percentage of the fair market value that is determined by local assessors to be the total taxable value of land and additions on the property. | Land | Improvement |
|---|---|---|---|---|
| 2025 | $14,929 | $1,324,700 | $678,300 | $646,400 |
| 2024 | $14,519 | $1,324,700 | $678,300 | $646,400 |
| 2023 | $14,170 | $1,162,400 | $600,800 | $561,600 |
| 2022 | $13,771 | $1,108,800 | $600,800 | $508,000 |
| 2021 | $14,011 | $1,087,000 | $579,000 | $508,000 |
| 2020 | $13,957 | $1,087,000 | $579,000 | $508,000 |
| 2019 | $14,055 | $1,087,000 | $579,000 | $508,000 |
| 2018 | $13,553 | $1,055,500 | $583,300 | $472,200 |
| 2017 | $12,582 | $964,100 | $491,900 | $472,200 |
| 2016 | $12,539 | $973,500 | $491,900 | $481,600 |
| 2015 | $12,059 | $949,500 | $467,900 | $481,600 |
Source: Public Records
Map
Nearby Homes
Your Personal Tour Guide
Ask me questions while you tour the home.