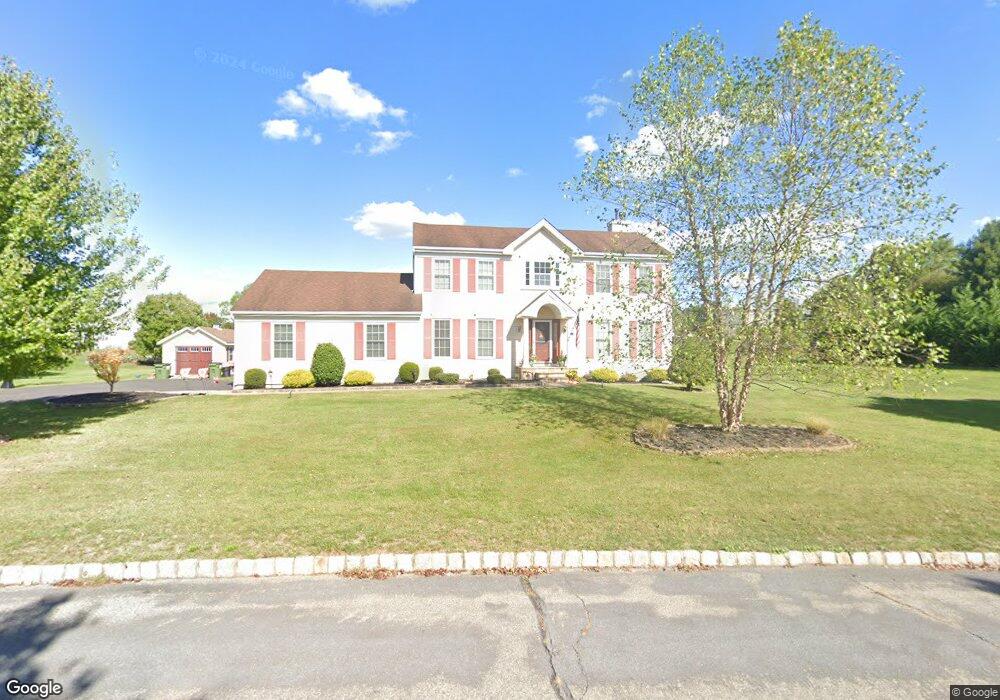
6 Hardy Dr Flemington, NJ 08822
Estimated Value: $676,198 - $807,000
--
Bed
--
Bath
2,103
Sq Ft
$352/Sq Ft
Est. Value
About This Home
This home is located at 6 Hardy Dr, Flemington, NJ 08822 and is currently estimated at $739,800, approximately $351 per square foot. 6 Hardy Dr is a home located in Hunterdon County with nearby schools including Barley Sheaf Elementary School, J.P. Case Middle School, and Reading Fleming Intermediate School.
Ownership History
Date
Name
Owned For
Owner Type
Purchase Details
Closed on
Sep 9, 2005
Sold by
Maciejewski Mark E and Maciejewski Nancy A
Bought by
Grubb Kevin C and Lopata Jennifer J
Current Estimated Value
Home Financials for this Owner
Home Financials are based on the most recent Mortgage that was taken out on this home.
Original Mortgage
$145,850
Outstanding Balance
$48,057
Interest Rate
5.84%
Mortgage Type
Credit Line Revolving
Estimated Equity
$691,743
Purchase Details
Closed on
Oct 17, 1996
Sold by
Wong Rowland
Bought by
Maciejewski Mark E and Maciejewski Nancy A
Home Financials for this Owner
Home Financials are based on the most recent Mortgage that was taken out on this home.
Original Mortgage
$185,000
Interest Rate
7.62%
Mortgage Type
Balloon
Purchase Details
Closed on
Sep 19, 1994
Sold by
Fallone Development Corp
Bought by
Wong Rowland
Create a Home Valuation Report for This Property
The Home Valuation Report is an in-depth analysis detailing your home's value as well as a comparison with similar homes in the area
Home Values in the Area
Average Home Value in this Area
Purchase History
| Date | Buyer | Sale Price | Title Company |
|---|---|---|---|
| Grubb Kevin C | $595,000 | -- | |
| Maciejewski Mark E | $239,900 | -- | |
| Wong Rowland | $254,655 | -- | |
| Fallone Development Corp | -- | -- |
Source: Public Records
Mortgage History
| Date | Status | Borrower | Loan Amount |
|---|---|---|---|
| Open | Grubb Kevin C | $145,850 | |
| Open | Grubb Kevin C | $359,650 | |
| Previous Owner | Maciejewski Mark E | $185,000 |
Source: Public Records
Tax History Compared to Growth
Tax History
| Year | Tax Paid | Tax Assessment Tax Assessment Total Assessment is a certain percentage of the fair market value that is determined by local assessors to be the total taxable value of land and additions on the property. | Land | Improvement |
|---|---|---|---|---|
| 2025 | $12,477 | $430,700 | $222,600 | $208,100 |
| 2024 | $11,732 | $430,700 | $222,600 | $208,100 |
| 2023 | $11,732 | $430,700 | $222,600 | $208,100 |
| 2022 | $11,435 | $430,700 | $222,600 | $208,100 |
| 2021 | $10,839 | $430,700 | $222,600 | $208,100 |
| 2020 | $11,073 | $430,700 | $222,600 | $208,100 |
| 2019 | $10,839 | $430,300 | $222,600 | $207,700 |
| 2018 | $10,706 | $430,300 | $222,600 | $207,700 |
| 2017 | $10,542 | $430,300 | $222,600 | $207,700 |
| 2016 | $10,353 | $430,300 | $222,600 | $207,700 |
| 2015 | $9,987 | $425,900 | $222,600 | $203,300 |
| 2014 | $9,855 | $425,900 | $222,600 | $203,300 |
Source: Public Records
Map
Nearby Homes
- 6 Elm Terrace
- 18 Burnett Ct
- 23 Maple Ct
- 405 Willow Ct
- 404 Willow Ct
- 1 Shady Ln
- 276 Spruce Ct
- 12 Higgins Ct
- 25 Indian Plantation St Unit 25
- 1201 Southard Ct
- 907 Reed Ct Unit C0907
- 17 Patrick Henry Place
- 27 Londonderry Dr
- 43 Everitts Rd
- 107 Provincetown Ct
- 106 Franklin Ct Unit 238
- 105 Franklin Ct Unit 237
- 12 Woodside Ln
- 31 Hancock Ct
- 84 Saxonney Cir