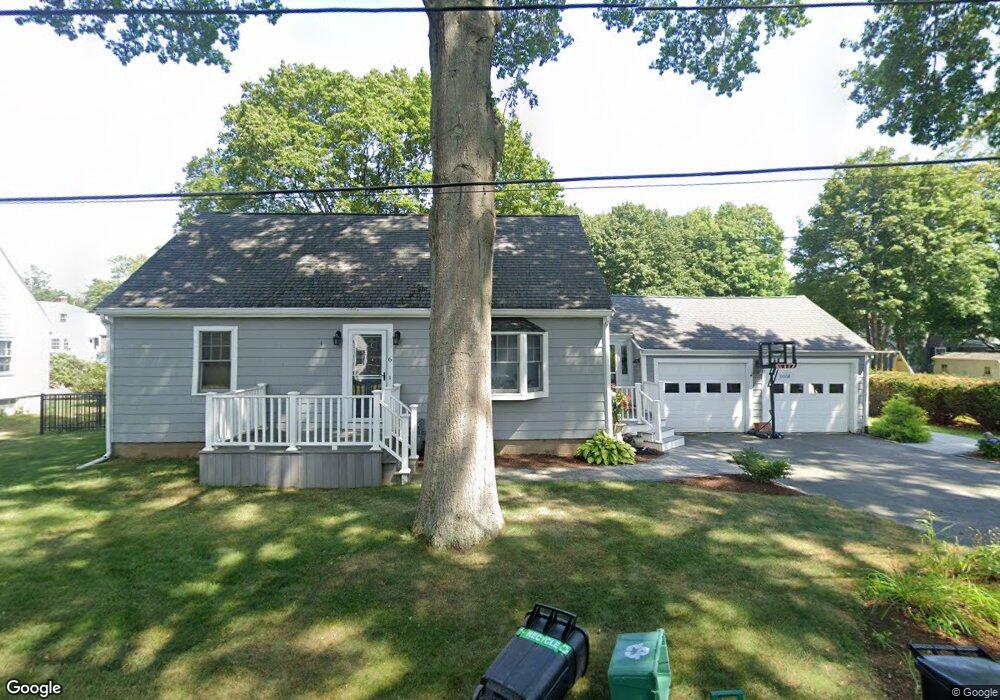
6 Howard St Wenham, MA 01984
Estimated Value: $799,000 - $982,000
4
Beds
2
Baths
1,326
Sq Ft
$651/Sq Ft
Est. Value
About This Home
This home is located at 6 Howard St, Wenham, MA 01984 and is currently estimated at $863,054, approximately $650 per square foot. 6 Howard St is a home located in Essex County with nearby schools including Winthrop School, Bessie Buker Elementary School, and Cutler Elementary School.
Ownership History
Date
Name
Owned For
Owner Type
Purchase Details
Closed on
Apr 24, 2018
Sold by
Rawston Ft
Bought by
Leaf Stephanie and Macdonald Jonathan
Current Estimated Value
Home Financials for this Owner
Home Financials are based on the most recent Mortgage that was taken out on this home.
Original Mortgage
$400,000
Outstanding Balance
$341,930
Interest Rate
4.46%
Mortgage Type
New Conventional
Estimated Equity
$521,124
Purchase Details
Closed on
Nov 1, 1983
Bought by
Rawston Robert F and Rawston Christine M
Create a Home Valuation Report for This Property
The Home Valuation Report is an in-depth analysis detailing your home's value as well as a comparison with similar homes in the area
Home Values in the Area
Average Home Value in this Area
Purchase History
| Date | Buyer | Sale Price | Title Company |
|---|---|---|---|
| Leaf Stephanie | $500,000 | -- | |
| Rawston Robert F | $80,000 | -- |
Source: Public Records
Mortgage History
| Date | Status | Borrower | Loan Amount |
|---|---|---|---|
| Open | Leaf Stephanie | $400,000 | |
| Previous Owner | Rawston Robert F | $50,000 | |
| Previous Owner | Rawston Robert F | $30,000 | |
| Previous Owner | Rawston Robert F | $35,000 |
Source: Public Records
Tax History
| Year | Tax Paid | Tax Assessment Tax Assessment Total Assessment is a certain percentage of the fair market value that is determined by local assessors to be the total taxable value of land and additions on the property. | Land | Improvement |
|---|---|---|---|---|
| 2025 | $10,838 | $697,400 | $415,000 | $282,400 |
| 2024 | $10,683 | $682,200 | $415,000 | $267,200 |
| 2023 | $10,766 | $620,500 | $441,600 | $178,900 |
| 2022 | $10,043 | $512,900 | $340,800 | $172,100 |
| 2021 | $9,596 | $487,600 | $315,500 | $172,100 |
| 2020 | $8,894 | $469,600 | $317,100 | $152,500 |
| 2019 | $8,462 | $469,600 | $317,100 | $152,500 |
| 2018 | $8,006 | $426,100 | $306,900 | $119,200 |
| 2017 | $7,810 | $426,100 | $306,900 | $119,200 |
| 2016 | $7,235 | $426,100 | $306,900 | $119,200 |
| 2015 | $6,924 | $426,100 | $306,900 | $119,200 |
Source: Public Records
Map
Nearby Homes
Your Personal Tour Guide
Ask me questions while you tour the home.