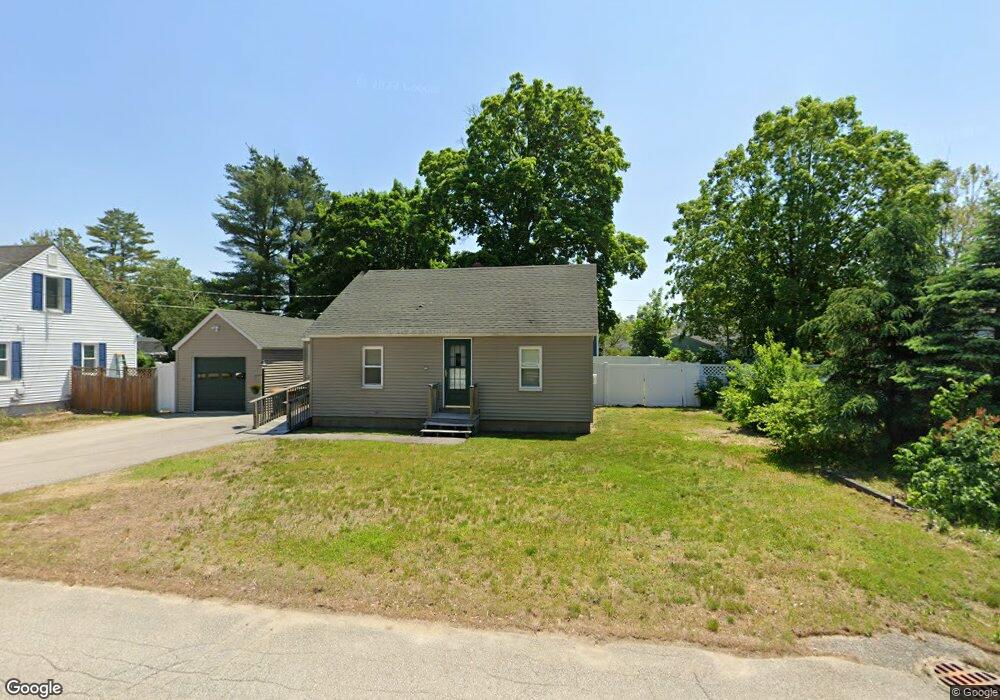
6 Janet St Rochester, NH 03867
Estimated Value: $335,000 - $364,000
4
Beds
1
Bath
1,092
Sq Ft
$321/Sq Ft
Est. Value
About This Home
This home is located at 6 Janet St, Rochester, NH 03867 and is currently estimated at $350,592, approximately $321 per square foot. 6 Janet St is a home located in Strafford County with nearby schools including Mcclelland School, Rochester Middle School, and Spaulding High School.
Ownership History
Date
Name
Owned For
Owner Type
Purchase Details
Closed on
Jul 1, 2010
Sold by
Department Of Housing & Urban Dev
Bought by
Richard Ann
Current Estimated Value
Home Financials for this Owner
Home Financials are based on the most recent Mortgage that was taken out on this home.
Original Mortgage
$88,273
Outstanding Balance
$59,126
Interest Rate
4.88%
Mortgage Type
Purchase Money Mortgage
Estimated Equity
$291,466
Purchase Details
Closed on
Jan 8, 2010
Sold by
Wells Fargo Bank Na
Bought by
Department Of Housing & Urban Dev
Purchase Details
Closed on
May 27, 2009
Sold by
Smith William N
Bought by
Wells Fargo Bank Na
Create a Home Valuation Report for This Property
The Home Valuation Report is an in-depth analysis detailing your home's value as well as a comparison with similar homes in the area
Home Values in the Area
Average Home Value in this Area
Purchase History
| Date | Buyer | Sale Price | Title Company |
|---|---|---|---|
| Richard Ann | $75,500 | -- | |
| Department Of Housing & Urban Dev | -- | -- | |
| Wells Fargo Bank Na | $67,500 | -- |
Source: Public Records
Mortgage History
| Date | Status | Borrower | Loan Amount |
|---|---|---|---|
| Open | Wells Fargo Bank Na | $88,273 |
Source: Public Records
Tax History Compared to Growth
Tax History
| Year | Tax Paid | Tax Assessment Tax Assessment Total Assessment is a certain percentage of the fair market value that is determined by local assessors to be the total taxable value of land and additions on the property. | Land | Improvement |
|---|---|---|---|---|
| 2024 | $4,320 | $290,900 | $81,800 | $209,100 |
| 2023 | $4,394 | $170,700 | $52,700 | $118,000 |
| 2022 | $4,315 | $170,700 | $52,700 | $118,000 |
| 2021 | $4,208 | $170,700 | $52,700 | $118,000 |
| 2020 | $4,228 | $171,800 | $52,700 | $119,100 |
| 2019 | $4,278 | $171,800 | $52,700 | $119,100 |
| 2018 | $3,977 | $144,500 | $35,900 | $108,600 |
| 2017 | $3,805 | $144,500 | $35,900 | $108,600 |
| 2016 | $3,660 | $129,500 | $35,900 | $93,600 |
| 2015 | $3,645 | $129,500 | $35,900 | $93,600 |
| 2014 | $3,557 | $129,500 | $35,900 | $93,600 |
| 2013 | $3,630 | $137,700 | $47,900 | $89,800 |
| 2012 | $3,536 | $137,700 | $47,900 | $89,800 |
Source: Public Records
Map
Nearby Homes