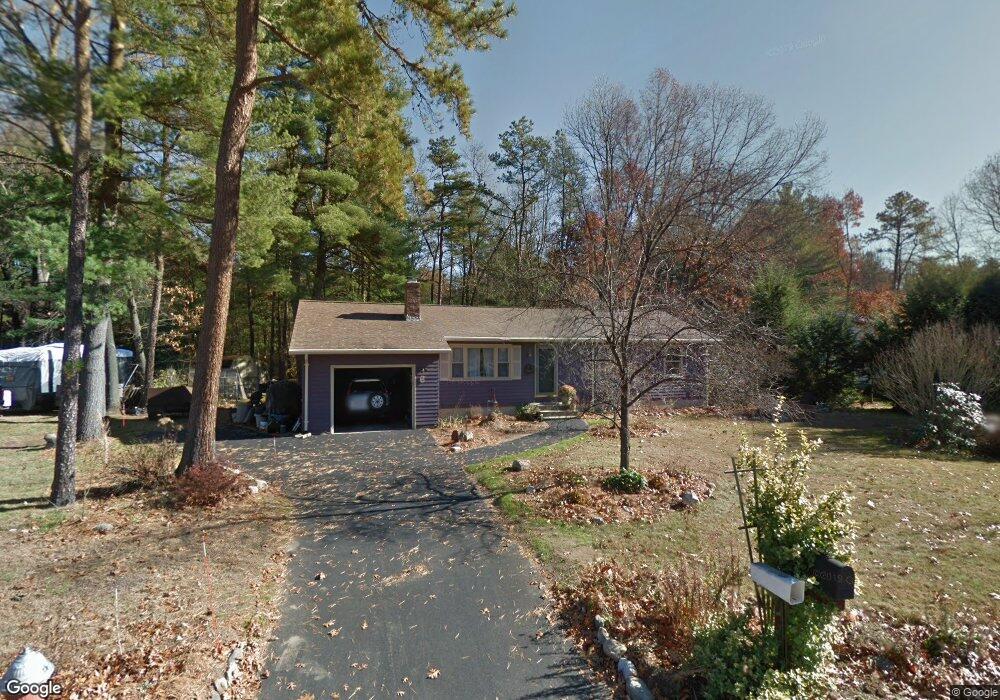
6 Kimberly Ln Easthampton, MA 01027
Estimated Value: $368,309 - $428,000
3
Beds
2
Baths
1,156
Sq Ft
$343/Sq Ft
Est. Value
About This Home
This home is located at 6 Kimberly Ln, Easthampton, MA 01027 and is currently estimated at $396,577, approximately $343 per square foot. 6 Kimberly Ln is a home located in Hampshire County with nearby schools including Easthampton High School, Calvary Baptist Christian School, and Tri-County Schools.
Ownership History
Date
Name
Owned For
Owner Type
Purchase Details
Closed on
Mar 26, 1999
Sold by
Hooker Marie S and Hooker Richard P
Bought by
Vishaway Jessie A
Current Estimated Value
Purchase Details
Closed on
Apr 30, 1990
Sold by
Hanno Dennis M
Bought by
Gagnon Stephen
Create a Home Valuation Report for This Property
The Home Valuation Report is an in-depth analysis detailing your home's value as well as a comparison with similar homes in the area
Home Values in the Area
Average Home Value in this Area
Purchase History
| Date | Buyer | Sale Price | Title Company |
|---|---|---|---|
| Vishaway Jessie A | $119,000 | -- | |
| Gagnon Stephen | $123,000 | -- |
Source: Public Records
Mortgage History
| Date | Status | Borrower | Loan Amount |
|---|---|---|---|
| Open | Gagnon Stephen | $110,000 | |
| Closed | Gagnon Stephen | $15,000 | |
| Closed | Gagnon Stephen | $124,500 |
Source: Public Records
Tax History
| Year | Tax Paid | Tax Assessment Tax Assessment Total Assessment is a certain percentage of the fair market value that is determined by local assessors to be the total taxable value of land and additions on the property. | Land | Improvement |
|---|---|---|---|---|
| 2025 | $4,264 | $311,900 | $120,700 | $191,200 |
| 2024 | $4,152 | $306,200 | $117,200 | $189,000 |
| 2023 | $3,415 | $233,100 | $92,200 | $140,900 |
| 2022 | $3,853 | $233,100 | $92,200 | $140,900 |
| 2021 | $4,211 | $240,100 | $92,200 | $147,900 |
| 2020 | $4,140 | $233,100 | $92,200 | $140,900 |
| 2019 | $3,587 | $232,000 | $92,200 | $139,800 |
| 2018 | $3,437 | $214,800 | $86,900 | $127,900 |
| 2017 | $3,355 | $207,000 | $83,500 | $123,500 |
| 2016 | $3,227 | $207,000 | $83,500 | $123,500 |
| 2015 | $3,136 | $207,000 | $83,500 | $123,500 |
Source: Public Records
Map
Nearby Homes
Your Personal Tour Guide
Ask me questions while you tour the home.