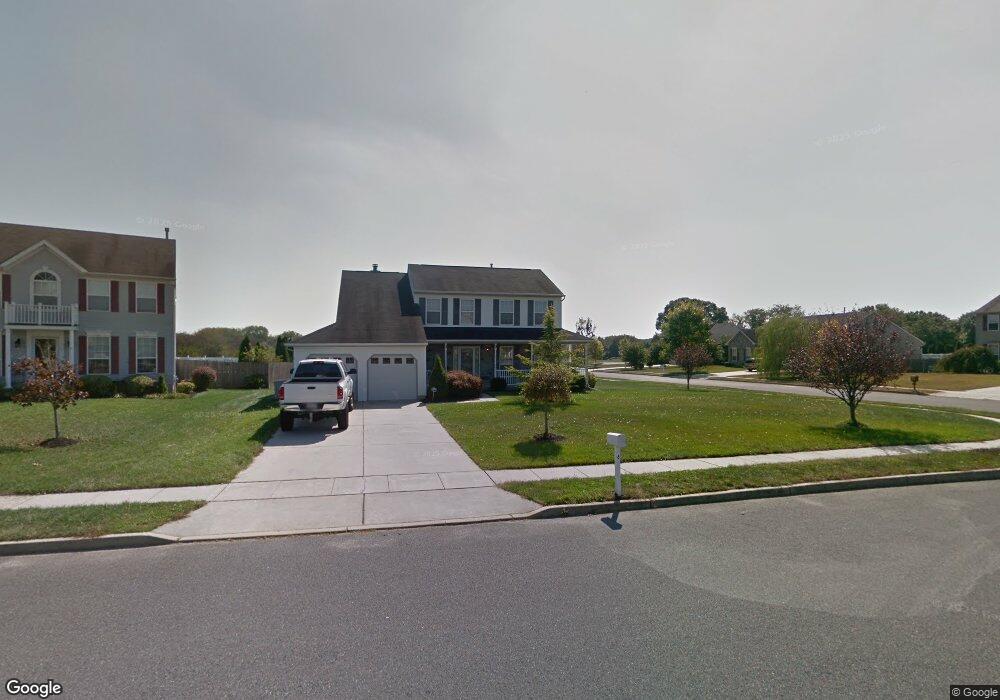
6 Lacy Ct Clayton, NJ 08312
Estimated Value: $443,204 - $459,000
3
Beds
3
Baths
2,562
Sq Ft
$176/Sq Ft
Est. Value
About This Home
This home is located at 6 Lacy Ct, Clayton, NJ 08312 and is currently estimated at $450,801, approximately $175 per square foot. 6 Lacy Ct is a home located in Gloucester County with nearby schools including Herma S. Simmons Elementary School, Clayton Middle School, and Clayton High School.
Ownership History
Date
Name
Owned For
Owner Type
Purchase Details
Closed on
Jun 13, 2011
Sold by
Cartus Financial Corporation
Bought by
Burton Lowrie E
Current Estimated Value
Home Financials for this Owner
Home Financials are based on the most recent Mortgage that was taken out on this home.
Original Mortgage
$191,968
Outstanding Balance
$132,277
Interest Rate
4.62%
Mortgage Type
New Conventional
Estimated Equity
$318,524
Purchase Details
Closed on
Apr 9, 2010
Sold by
Rusnak Richard D and Rusnak Cynthia A
Bought by
Cartus Financial Corporation
Purchase Details
Closed on
Aug 31, 2001
Sold by
Clayton Countryside Associates
Bought by
Rusnak Richard D and Rusnak Cynthia A
Home Financials for this Owner
Home Financials are based on the most recent Mortgage that was taken out on this home.
Original Mortgage
$90,000
Interest Rate
7.05%
Mortgage Type
Purchase Money Mortgage
Create a Home Valuation Report for This Property
The Home Valuation Report is an in-depth analysis detailing your home's value as well as a comparison with similar homes in the area
Home Values in the Area
Average Home Value in this Area
Purchase History
| Date | Buyer | Sale Price | Title Company |
|---|---|---|---|
| Burton Lowrie E | $195,000 | Old Republic National Title | |
| Cartus Financial Corporation | $195,000 | Old Republic National Title | |
| Rusnak Richard D | $162,225 | -- |
Source: Public Records
Mortgage History
| Date | Status | Borrower | Loan Amount |
|---|---|---|---|
| Open | Burton Lowrie E | $191,968 | |
| Previous Owner | Rusnak Richard D | $90,000 |
Source: Public Records
Tax History Compared to Growth
Tax History
| Year | Tax Paid | Tax Assessment Tax Assessment Total Assessment is a certain percentage of the fair market value that is determined by local assessors to be the total taxable value of land and additions on the property. | Land | Improvement |
|---|---|---|---|---|
| 2025 | $9,316 | $376,400 | $80,300 | $296,100 |
| 2024 | $8,599 | $376,400 | $80,300 | $296,100 |
| 2023 | $8,599 | $212,800 | $46,900 | $165,900 |
| 2022 | $8,506 | $212,800 | $46,900 | $165,900 |
| 2021 | $8,403 | $212,800 | $46,900 | $165,900 |
| 2020 | $8,421 | $212,800 | $46,900 | $165,900 |
| 2019 | $8,278 | $212,800 | $46,900 | $165,900 |
| 2018 | $8,161 | $212,800 | $46,900 | $165,900 |
| 2017 | $8,023 | $212,800 | $46,900 | $165,900 |
| 2016 | $7,937 | $212,800 | $46,900 | $165,900 |
| 2015 | $7,703 | $212,800 | $46,900 | $165,900 |
| 2014 | $7,435 | $212,800 | $46,900 | $165,900 |
Source: Public Records
Map
Nearby Homes
- 13 W Dehart Ave
- 510 Coleman Dr
- 35 W Dehart Ave
- 6 Dubois Ave
- 338 Sugar Hill Dr
- 320 E Clayton Ave
- 7 Hawthorn Way
- 216 E Howard St
- 807 N New St
- 170 S Dennis Dr
- 180 S Dennis Dr
- 125 W Clayton Ave
- 237 S Delsea Dr
- 779 East Ave
- 131 W Clinton St
- 124 W Howard St
- 238 W Center St
- 271 Kille Rd
- 100 Aura Rd Unit 112
- 100 Aura Rd Unit 212