L
Seller's Agent in 2025
LAURA LABRIE
Homefront Realty, LLC
(603) 233-4238
2 in this area
32 Total Sales

Welcome to this charming Colonial tucked away in a peaceful Nashua neighborhood—just minutes from top shopping, dining, and everyday amenities.
With a spacious layout and thoughtful updates throughout, this home combines comfort, convenience, and room to grow.
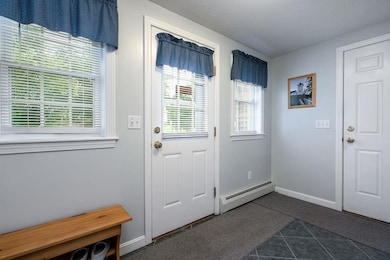
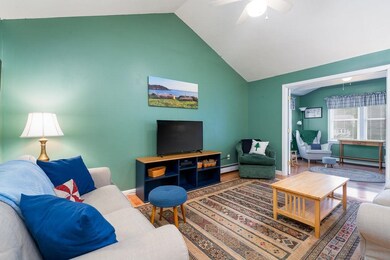
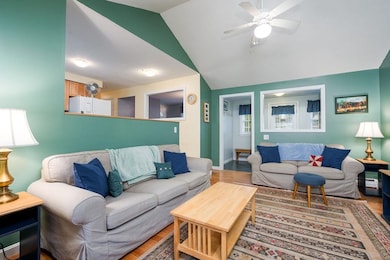
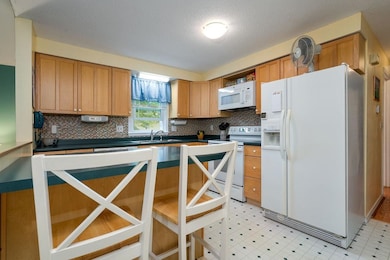
Enter through the inviting front door or directly from the oversized garage into a practical mudroom—perfect for New England living. Inside, the cathedral-ceiling, open-concept living room connects seamlessly to a cozy sunroom, offering versatile space for entertaining or quiet relaxation. A dedicated home office, 3⁄4 bathroom, formal dining room, and an additional living room complete the main floor.
Upstairs, you'll find four bedrooms with ample closet space, as well as a full bathroom.
The partially finished basement offers even more flexibility, featuring its own heating zone, a dedicated laundry area, walk-out access to the backyard, and a bonus storage room—ideal for tools, seasonal items, or a workshop.
Outside, enjoy a beautifully maintained lawn supported by an irrigation system, ensuring lush curb appeal all season long.
Come take a look—your future home awaits!
Showings begin at the Open House:
Saturday, June 28th from 1–3 PM
Sunday, June 29th from 1–3 PM
Last Agent to Sell the Property
Homefront Realty, LLC License #073841 Listed on: 06/26/2025
| Date | Type | Sale Price | Title Company |
|---|---|---|---|
| Warranty Deed | $595,000 | -- | |
| Quit Claim Deed | -- | None Available | |
| Quit Claim Deed | -- | None Available | |
| Quit Claim Deed | -- | None Available | |
| Quit Claim Deed | -- | None Available | |
| Quit Claim Deed | -- | None Available | |
| Quit Claim Deed | -- | None Available | |
| Warranty Deed | $154,500 | -- | |
| Warranty Deed | $154,500 | -- |
| Date | Status | Loan Amount | Loan Type |
|---|---|---|---|
| Open | $415,000 | New Conventional | |
| Previous Owner | $150,000 | Credit Line Revolving | |
| Previous Owner | $212,000 | No Value Available | |
| Previous Owner | $26,235 | No Value Available | |
| Previous Owner | $80,000 | No Value Available |
| Date | Event | Price | List to Sale | Price per Sq Ft |
|---|---|---|---|---|
| 08/15/2025 08/15/25 | Sold | $595,000 | +3.5% | $274 / Sq Ft |
| 06/26/2025 06/26/25 | For Sale | $575,000 | -- | $265 / Sq Ft |
| Year | Tax Paid | Tax Assessment Tax Assessment Total Assessment is a certain percentage of the fair market value that is determined by local assessors to be the total taxable value of land and additions on the property. | Land | Improvement |
|---|---|---|---|---|
| 2024 | $7,632 | $480,000 | $158,000 | $322,000 |
| 2023 | $7,230 | $396,600 | $126,400 | $270,200 |
| 2022 | $7,167 | $396,600 | $126,400 | $270,200 |
| 2021 | $6,896 | $297,000 | $84,300 | $212,700 |
| 2020 | $6,715 | $297,000 | $84,300 | $212,700 |
| 2019 | $6,463 | $297,000 | $84,300 | $212,700 |
| 2018 | $6,299 | $297,000 | $84,300 | $212,700 |
| 2017 | $6,502 | $252,100 | $65,500 | $186,600 |
| 2016 | $6,320 | $252,100 | $65,500 | $186,600 |
| 2015 | $6,184 | $252,100 | $65,500 | $186,600 |
| 2014 | $6,063 | $252,100 | $65,500 | $186,600 |
L
Seller's Agent in 2025
LAURA LABRIE
Homefront Realty, LLC
(603) 233-4238
2 in this area
32 Total Sales
M
Buyer's Agent in 2025
Mei Howes
Greatland Real Estate LLC
(617) 308-3925
2 in this area
19 Total Sales
Source: PrimeMLS
MLS Number: 5048630
APN: NASH-000000-000000-001856B
Disclaimer: Certain information contained herein is derived from information provided by parties other than Homes.com. All information provided is deemed reliable, but is not guaranteed to be accurate and should be independently verified.
![]() Copyright 2025 PrimeMLS, Inc. All rights reserved. This information is deemed reliable, but not guaranteed. The data relating to real estate displayed on this display comes in part from the IDX Program of PrimeMLS. The information being provided is for consumers’ personal, non-commercial use and may not be used for any purpose other than to identify prospective properties consumers may be interested in purchasing.
Copyright 2025 PrimeMLS, Inc. All rights reserved. This information is deemed reliable, but not guaranteed. The data relating to real estate displayed on this display comes in part from the IDX Program of PrimeMLS. The information being provided is for consumers’ personal, non-commercial use and may not be used for any purpose other than to identify prospective properties consumers may be interested in purchasing.
