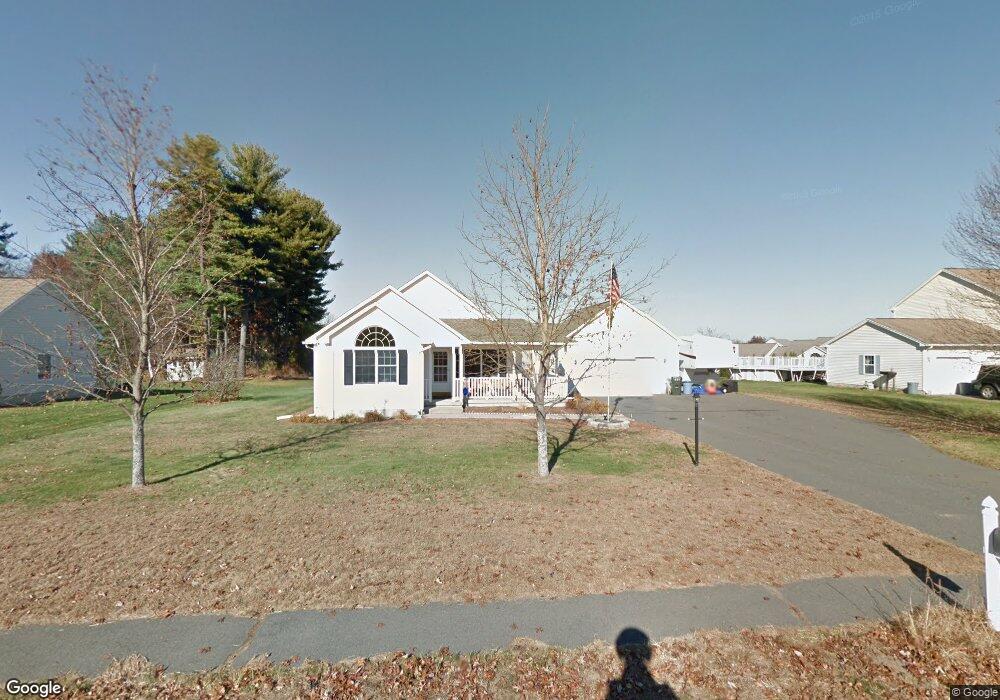
6 Laurel Dr Easthampton, MA 01027
Estimated Value: $426,000 - $521,000
3
Beds
3
Baths
1,312
Sq Ft
$367/Sq Ft
Est. Value
About This Home
This home is located at 6 Laurel Dr, Easthampton, MA 01027 and is currently estimated at $481,765, approximately $367 per square foot. 6 Laurel Dr is a home located in Hampshire County with nearby schools including Easthampton High School, Calvary Baptist Christian School, and Tri-County Schools.
Ownership History
Date
Name
Owned For
Owner Type
Purchase Details
Closed on
Feb 28, 1997
Sold by
Bishop Roger P
Bought by
Lanty Doris M and Lanty John T
Current Estimated Value
Home Financials for this Owner
Home Financials are based on the most recent Mortgage that was taken out on this home.
Original Mortgage
$137,750
Interest Rate
7.78%
Mortgage Type
Purchase Money Mortgage
Create a Home Valuation Report for This Property
The Home Valuation Report is an in-depth analysis detailing your home's value as well as a comparison with similar homes in the area
Home Values in the Area
Average Home Value in this Area
Purchase History
| Date | Buyer | Sale Price | Title Company |
|---|---|---|---|
| Lanty Doris M | $145,000 | -- |
Source: Public Records
Mortgage History
| Date | Status | Borrower | Loan Amount |
|---|---|---|---|
| Open | Lanty Doris M | $49,300 | |
| Open | Lanty Doris M | $199,500 | |
| Closed | Lanty Doris M | $29,999 | |
| Closed | Lanty Doris M | $137,750 |
Source: Public Records
Tax History
| Year | Tax Paid | Tax Assessment Tax Assessment Total Assessment is a certain percentage of the fair market value that is determined by local assessors to be the total taxable value of land and additions on the property. | Land | Improvement |
|---|---|---|---|---|
| 2025 | $5,925 | $433,400 | $133,300 | $300,100 |
| 2024 | $5,763 | $425,000 | $129,400 | $295,600 |
| 2023 | $4,506 | $307,600 | $102,600 | $205,000 |
| 2022 | $5,085 | $307,600 | $102,600 | $205,000 |
| 2021 | $5,578 | $318,000 | $102,600 | $215,400 |
| 2020 | $5,463 | $307,600 | $102,600 | $205,000 |
| 2019 | $4,830 | $312,400 | $119,800 | $192,600 |
| 2018 | $4,624 | $289,000 | $113,000 | $176,000 |
| 2017 | $4,513 | $278,400 | $108,600 | $169,800 |
| 2016 | $4,340 | $278,400 | $108,600 | $169,800 |
| 2015 | $4,218 | $278,400 | $108,600 | $169,800 |
Source: Public Records
Map
Nearby Homes
Your Personal Tour Guide
Ask me questions while you tour the home.