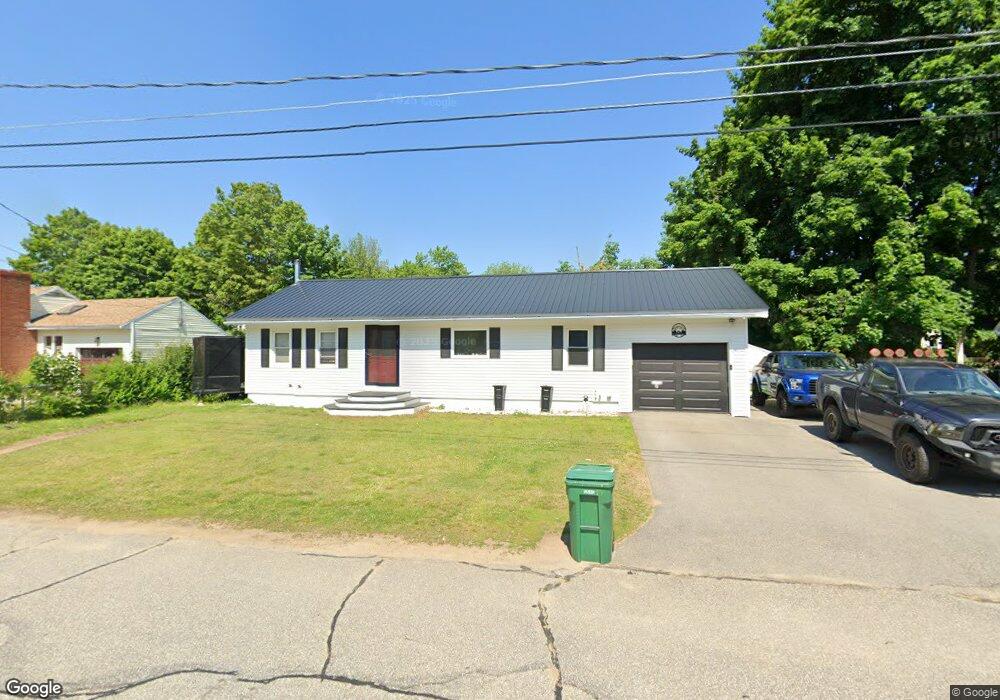
6 Letourneau St Rochester, NH 03867
Estimated Value: $362,000 - $411,651
3
Beds
2
Baths
2,288
Sq Ft
$166/Sq Ft
Est. Value
About This Home
This home is located at 6 Letourneau St, Rochester, NH 03867 and is currently estimated at $378,913, approximately $165 per square foot. 6 Letourneau St is a home located in Strafford County with nearby schools including Mcclelland School, Rochester Middle School, and Spaulding High School.
Ownership History
Date
Name
Owned For
Owner Type
Purchase Details
Closed on
Sep 4, 2024
Sold by
Wingate Sharon R and Wingate Bradley J
Bought by
Wingate Ft and Wingate
Current Estimated Value
Purchase Details
Closed on
Oct 22, 2013
Sold by
Wingate Sharon
Bought by
Wingate Sharon R and Wingate Bradley J
Purchase Details
Closed on
Apr 27, 2011
Sold by
Fnma
Bought by
Wingate Sharon
Home Financials for this Owner
Home Financials are based on the most recent Mortgage that was taken out on this home.
Original Mortgage
$84,000
Interest Rate
4.76%
Mortgage Type
Purchase Money Mortgage
Purchase Details
Closed on
Dec 22, 2010
Sold by
Buchikos William A and Fnma
Bought by
Federal National Mortgage Association
Purchase Details
Closed on
Jul 26, 2006
Sold by
Weeks David J Est
Bought by
Buchikos William A and Buchikos Lesly M
Create a Home Valuation Report for This Property
The Home Valuation Report is an in-depth analysis detailing your home's value as well as a comparison with similar homes in the area
Home Values in the Area
Average Home Value in this Area
Purchase History
| Date | Buyer | Sale Price | Title Company |
|---|---|---|---|
| Wingate Ft | -- | None Available | |
| Wingate Ft | -- | None Available | |
| Wingate Sharon R | -- | -- | |
| Wingate Sharon | $52,500 | -- | |
| Federal National Mortgage Association | $190,000 | -- | |
| Buchikos William A | $195,000 | -- | |
| Buchikos William A | $195,000 | -- | |
| Wingate Sharon R | -- | -- | |
| Wingate Sharon | $52,500 | -- | |
| Federal National Mortgage Association | $190,000 | -- | |
| Buchikos William A | $195,000 | -- |
Source: Public Records
Mortgage History
| Date | Status | Borrower | Loan Amount |
|---|---|---|---|
| Previous Owner | Buchikos William A | $84,000 | |
| Previous Owner | Buchikos William A | $162,000 |
Source: Public Records
Tax History Compared to Growth
Tax History
| Year | Tax Paid | Tax Assessment Tax Assessment Total Assessment is a certain percentage of the fair market value that is determined by local assessors to be the total taxable value of land and additions on the property. | Land | Improvement |
|---|---|---|---|---|
| 2024 | $4,599 | $309,700 | $78,900 | $230,800 |
| 2023 | $4,147 | $161,100 | $52,500 | $108,600 |
| 2022 | $4,073 | $161,100 | $52,500 | $108,600 |
| 2021 | $3,971 | $161,100 | $52,500 | $108,600 |
| 2020 | $3,965 | $161,100 | $52,500 | $108,600 |
| 2019 | $4,011 | $161,100 | $52,500 | $108,600 |
| 2018 | $4,051 | $147,200 | $35,700 | $111,500 |
| 2017 | $3,876 | $147,200 | $35,700 | $111,500 |
| 2016 | $3,807 | $134,700 | $35,700 | $99,000 |
| 2015 | $3,792 | $134,700 | $35,700 | $99,000 |
| 2014 | $3,700 | $134,700 | $35,700 | $99,000 |
| 2013 | $4,131 | $156,700 | $47,600 | $109,100 |
| 2012 | $4,024 | $156,700 | $47,600 | $109,100 |
Source: Public Records
Map
Nearby Homes
- 45 Cushing Blvd
- 2 Hale St
- 0 Washington St
- 161 N Main St
- 53 Washington St
- 53 Pine St
- 52 Riverview Dr
- 75 Washington St
- 51 Chestnut St
- 81 Washington St
- 86 Wakefield St
- 10 Clearview Dr
- 25 West Ln
- 24 Lyons St
- 105 Maple St
- 157 Wakefield St
- 66 Chestnut Hill Rd
- 15 Tampa Dr Unit C
- 13 Miami Way Unit B
- 2 Cape Coral Way Unit B