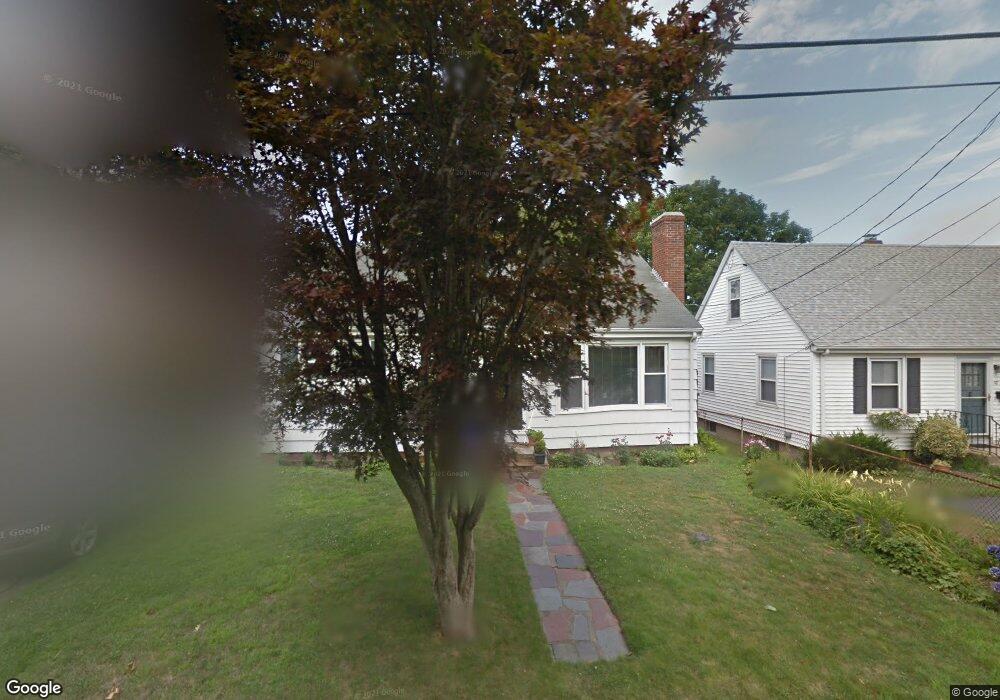
6 Linden St Middletown, RI 02842
Estimated Value: $504,000 - $679,000
3
Beds
1
Bath
1,080
Sq Ft
$569/Sq Ft
Est. Value
About This Home
This home is located at 6 Linden St, Middletown, RI 02842 and is currently estimated at $614,980, approximately $569 per square foot. 6 Linden St is a home located in Newport County with nearby schools including Middletown High School, All Saints STEAM Academy, and St Michael's Country Day School.
Ownership History
Date
Name
Owned For
Owner Type
Purchase Details
Closed on
Jan 22, 1999
Sold by
Elmasian Richard D
Bought by
Alcocer Michele E
Current Estimated Value
Home Financials for this Owner
Home Financials are based on the most recent Mortgage that was taken out on this home.
Original Mortgage
$112,500
Interest Rate
6.7%
Purchase Details
Closed on
Oct 7, 1994
Sold by
Droogan John P and Droogan Mary
Bought by
Elmasian Richard D and Mcbride Melissa A
Home Financials for this Owner
Home Financials are based on the most recent Mortgage that was taken out on this home.
Original Mortgage
$100,000
Interest Rate
8.55%
Create a Home Valuation Report for This Property
The Home Valuation Report is an in-depth analysis detailing your home's value as well as a comparison with similar homes in the area
Home Values in the Area
Average Home Value in this Area
Purchase History
| Date | Buyer | Sale Price | Title Company |
|---|---|---|---|
| Alcocer Michele E | $116,000 | -- | |
| Elmasian Richard D | $112,000 | -- |
Source: Public Records
Mortgage History
| Date | Status | Borrower | Loan Amount |
|---|---|---|---|
| Open | Elmasian Richard D | $123,618 | |
| Closed | Elmasian Richard D | $143,000 | |
| Closed | Elmasian Richard D | $112,500 | |
| Previous Owner | Elmasian Richard D | $100,000 |
Source: Public Records
Tax History Compared to Growth
Tax History
| Year | Tax Paid | Tax Assessment Tax Assessment Total Assessment is a certain percentage of the fair market value that is determined by local assessors to be the total taxable value of land and additions on the property. | Land | Improvement |
|---|---|---|---|---|
| 2024 | $6,202 | $550,800 | $396,700 | $154,100 |
| 2023 | $4,182 | $332,200 | $213,300 | $118,900 |
| 2022 | $3,993 | $332,200 | $213,300 | $118,900 |
| 2021 | $3,993 | $332,200 | $213,300 | $118,900 |
| 2020 | $3,927 | $285,400 | $163,200 | $122,200 |
| 2018 | $3,924 | $285,400 | $163,200 | $122,200 |
| 2016 | $3,712 | $240,700 | $139,400 | $101,300 |
| 2015 | $3,620 | $240,700 | $139,400 | $101,300 |
| 2014 | $3,709 | $230,800 | $126,600 | $104,200 |
| 2013 | $3,626 | $230,800 | $126,600 | $104,200 |
Source: Public Records
Map
Nearby Homes