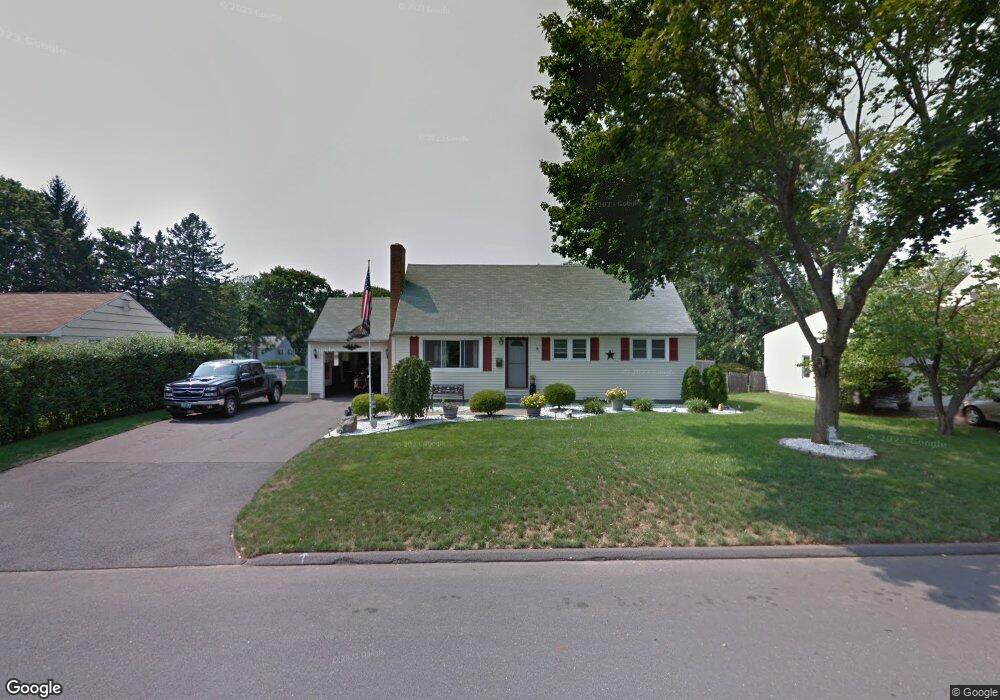
6 Locke Dr Enfield, CT 06082
Estimated Value: $309,000 - $340,000
5
Beds
2
Baths
1,440
Sq Ft
$228/Sq Ft
Est. Value
About This Home
This home is located at 6 Locke Dr, Enfield, CT 06082 and is currently estimated at $328,957, approximately $228 per square foot. 6 Locke Dr is a home located in Hartford County with nearby schools including Eli Whitney Elementary School, Hazardville Memorial Elementary School, and John F. Kennedy Middle School.
Ownership History
Date
Name
Owned For
Owner Type
Purchase Details
Closed on
Feb 28, 2006
Sold by
Smith Joseph and Smith Jodie
Bought by
Butcher Joseph and Butcher Elizabeth
Current Estimated Value
Purchase Details
Closed on
Feb 26, 1996
Sold by
Ho Tin and Tran Mai
Bought by
Smith Joseph and Perkins Jodie
Purchase Details
Closed on
Sep 1, 1987
Sold by
Sayles Kenneth
Bought by
Ho Tin P
Create a Home Valuation Report for This Property
The Home Valuation Report is an in-depth analysis detailing your home's value as well as a comparison with similar homes in the area
Home Values in the Area
Average Home Value in this Area
Purchase History
| Date | Buyer | Sale Price | Title Company |
|---|---|---|---|
| Butcher Joseph | $200,000 | -- | |
| Smith Joseph | $108,000 | -- | |
| Ho Tin P | $131,000 | -- |
Source: Public Records
Mortgage History
| Date | Status | Borrower | Loan Amount |
|---|---|---|---|
| Open | Ho Tin P | $66,136 | |
| Closed | Ho Tin P | $15,653 | |
| Open | Ho Tin P | $245,122 |
Source: Public Records
Tax History Compared to Growth
Tax History
| Year | Tax Paid | Tax Assessment Tax Assessment Total Assessment is a certain percentage of the fair market value that is determined by local assessors to be the total taxable value of land and additions on the property. | Land | Improvement |
|---|---|---|---|---|
| 2025 | $5,759 | $164,600 | $56,400 | $108,200 |
| 2024 | $5,605 | $164,600 | $56,400 | $108,200 |
| 2023 | $5,563 | $164,600 | $56,400 | $108,200 |
| 2022 | $5,052 | $164,600 | $56,400 | $108,200 |
| 2021 | $4,883 | $130,120 | $46,660 | $83,460 |
| 2020 | $4,883 | $130,120 | $46,660 | $83,460 |
| 2019 | $4,896 | $130,120 | $46,660 | $83,460 |
| 2018 | $4,814 | $130,120 | $46,660 | $83,460 |
| 2017 | $4,545 | $130,120 | $46,660 | $83,460 |
| 2016 | $4,440 | $129,410 | $47,880 | $81,530 |
| 2015 | $4,302 | $129,410 | $47,880 | $81,530 |
| 2014 | $4,190 | $129,410 | $47,880 | $81,530 |
Source: Public Records
Map
Nearby Homes
- 10-1/2 South Rd
- 46 Beech Rd
- 84 Raffia Rd
- 23 Clear St
- 30 David St
- 33 Liberty Ln
- 38 Liberty Ln
- 52 Liberty Ln
- 37 Liberty Ln
- 35 Liberty Ln
- 92 Post Office Rd
- 83 Oldefield Farms Unit 83
- 85 Oldefield Farms Unit 85
- 3 Avon Street Extension
- 5 Spier Ave
- 1165 Enfield St Unit 11
- 4 Georgetown Unit A
- 4 Bradley Cir Unit D
- 233 Post Office Rd
- 6 Hathaway Ave